The Redispatch Stream Has a Geography
Sixth and last entry in this series on the research process behind a voltage-screening pipeline. The first five posts were about fixing things that were wrong — a provenance gap, a circular threshold, an unjustified sample size. This one is about something that turned up while building a supporting figure, not while fixing a flaw: the same redispatch dataset the first post introduced turns out to have a sharp, real geographic structure, and it splits the country almost exactly the way German energy-policy discussion says it should.
What was actually being built
The dataset behind this whole series — one year of real German TSO redispatch instructions, 20,586 events — carries a field the pipeline never uses: ANWEISENDER_UENB, the transmission system operator that issued each instruction. It's always exactly one of Germany's four TSOs: 50Hertz, Amprion, TenneT, TransnetBW. That field played no role in the screening pipeline itself, which only cares about an event's magnitude and timing. But it's sitting right there in every row, and each of those four TSOs has a real, fixed, official service territory.
Pairing that field against a public district-to-TSO boundary mapping and aggregating the dataset by zone turns out to produce a genuinely interesting picture — one that has nothing to do with the pipeline's screening results, and everything to do with what the dataset itself is actually describing.
The pattern
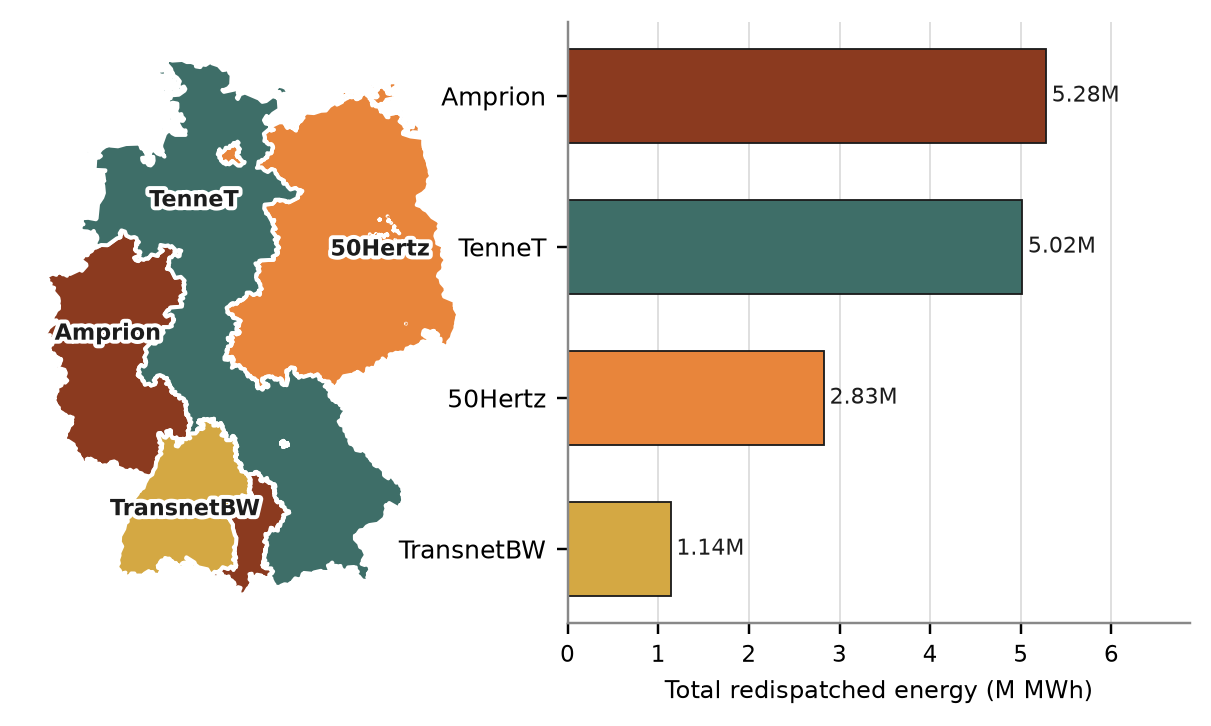
Zone boundaries dissolved from real NUTS3 district-to-TSO assignments (Frysztacki, 2023, CC BY 4.0). Colored by zone identity, ranked by total redispatched energy.
Total redispatched energy varies 4.6× across the four zones — from 1.14 million MWh (TransnetBW, the smallest) to 5.28 million MWh (Amprion, the largest). That gap alone isn't surprising; the four zones are different sizes. What's more interesting is what happens when the direction of each instruction is layered in.
Germany's redispatch instructions come in two flavors: reduce feed-in, or increase it. Split by zone:
- TenneT and 50Hertz — the northern and northeastern zones, carrying the country's offshore and onshore wind buildout — are decrease-dominated: TenneT runs 4,395 decrease instructions against 2,205 increase, 50Hertz 5,477 against 865. That's the signature of curtailment: more generation available than the local grid can carry, so it gets throttled back.
- Amprion and TransnetBW — the western and southwestern zones, carrying Germany's traditional industrial and conventional-generation base — are increase-dominated: Amprion runs 3,349 increase instructions against 1,415 decrease, TransnetBW 2,437 against 443. That's the signature of compensation: generation gets turned up downstream to make up for what got curtailed upstream.
The energy-mix split lines up the same way. Renewable-attributed events make up the bulk of TenneT's and 50Hertz's activity (3,513 and 2,656 events respectively); Amprion's and TransnetBW's activity is almost entirely conventional (4,675 and 1,621 events, against only 54 and 15 renewable-attributed events). None of this was designed into the dataset for this series — it's just what one real year of German grid operations looks like when you group it by who's operating the grid.
Why this isn't a coincidence
This is the textbook description of Germany's Energiewende geography: renewable generation concentrated in the windy north, industrial demand concentrated in the west and south, and a transmission grid still catching up to the mismatch between where the power is generated and where it's consumed. Redispatch is the operational patch for that mismatch — throttle generation where there's too much of it relative to local grid capacity, compensate downstream where there isn't enough. Seeing that mechanism show up cleanly in a year of real instruction data, split almost perfectly along TSO boundaries, is a satisfying confirmation of something usually described only in the abstract.

Kinetic to Clean Electricity
Wind Energy Integration
From rotating blades to grid connection. The sophisticated nacelle protects the high-speed gearbox and generator assembly, converting kinetic wind energy into clean, phase-synchronized 33kV electricity for immediate grid export.
What this is and isn't
Worth being precise about scope, in keeping with the rest of this series: this is a property of the input dataset, not a validated finding about any specific network. The pipeline's actual screening results — violation counts, recall, the step-function finding — are all computed on one benchmark distribution network, not on real German feeders, and never touch this geographic field. This map doesn't change or extend any of those results. It's a separate, smaller finding about what the real-world dataset underneath the pipeline actually looks like — worth understanding on its own terms, not worth overstating as more than that.
Reproducibility: aggregating redispatch volume by TSO zone
import pandas as pd

df = pd.read_csv("redispatch_1yr.csv", sep=";")
df["GESAMTE_ARBEIT_MWH"] = pd.to_numeric(df["GESAMTE_ARBEIT_MWH"], errors="coerce")

agg = df.groupby("ANWEISENDER_UENB").agg(
    total_mwh=("GESAMTE_ARBEIT_MWH", "sum"),
    n_increase=("RICHTUNG", lambda s: (s == "Wirkleistungseinspeisung erhöhen").sum()),
    n_decrease=("RICHTUNG", lambda s: (s == "Wirkleistungseinspeisung reduzieren").sum()),
    n_renewable=("PRIMAERENERGIEART", lambda s: (s == "Erneuerbar").sum()),
    n_conventional=("PRIMAERENERGIEART", lambda s: (s == "Konventionell").sum()),
).reset_index()

print(agg.to_string(index=False))
# Zone boundaries: NUTS3 district-to-TSO mapping, Frysztacki (2023),
# Zenodo, CC BY 4.0 -- dissolved and simplified for display.