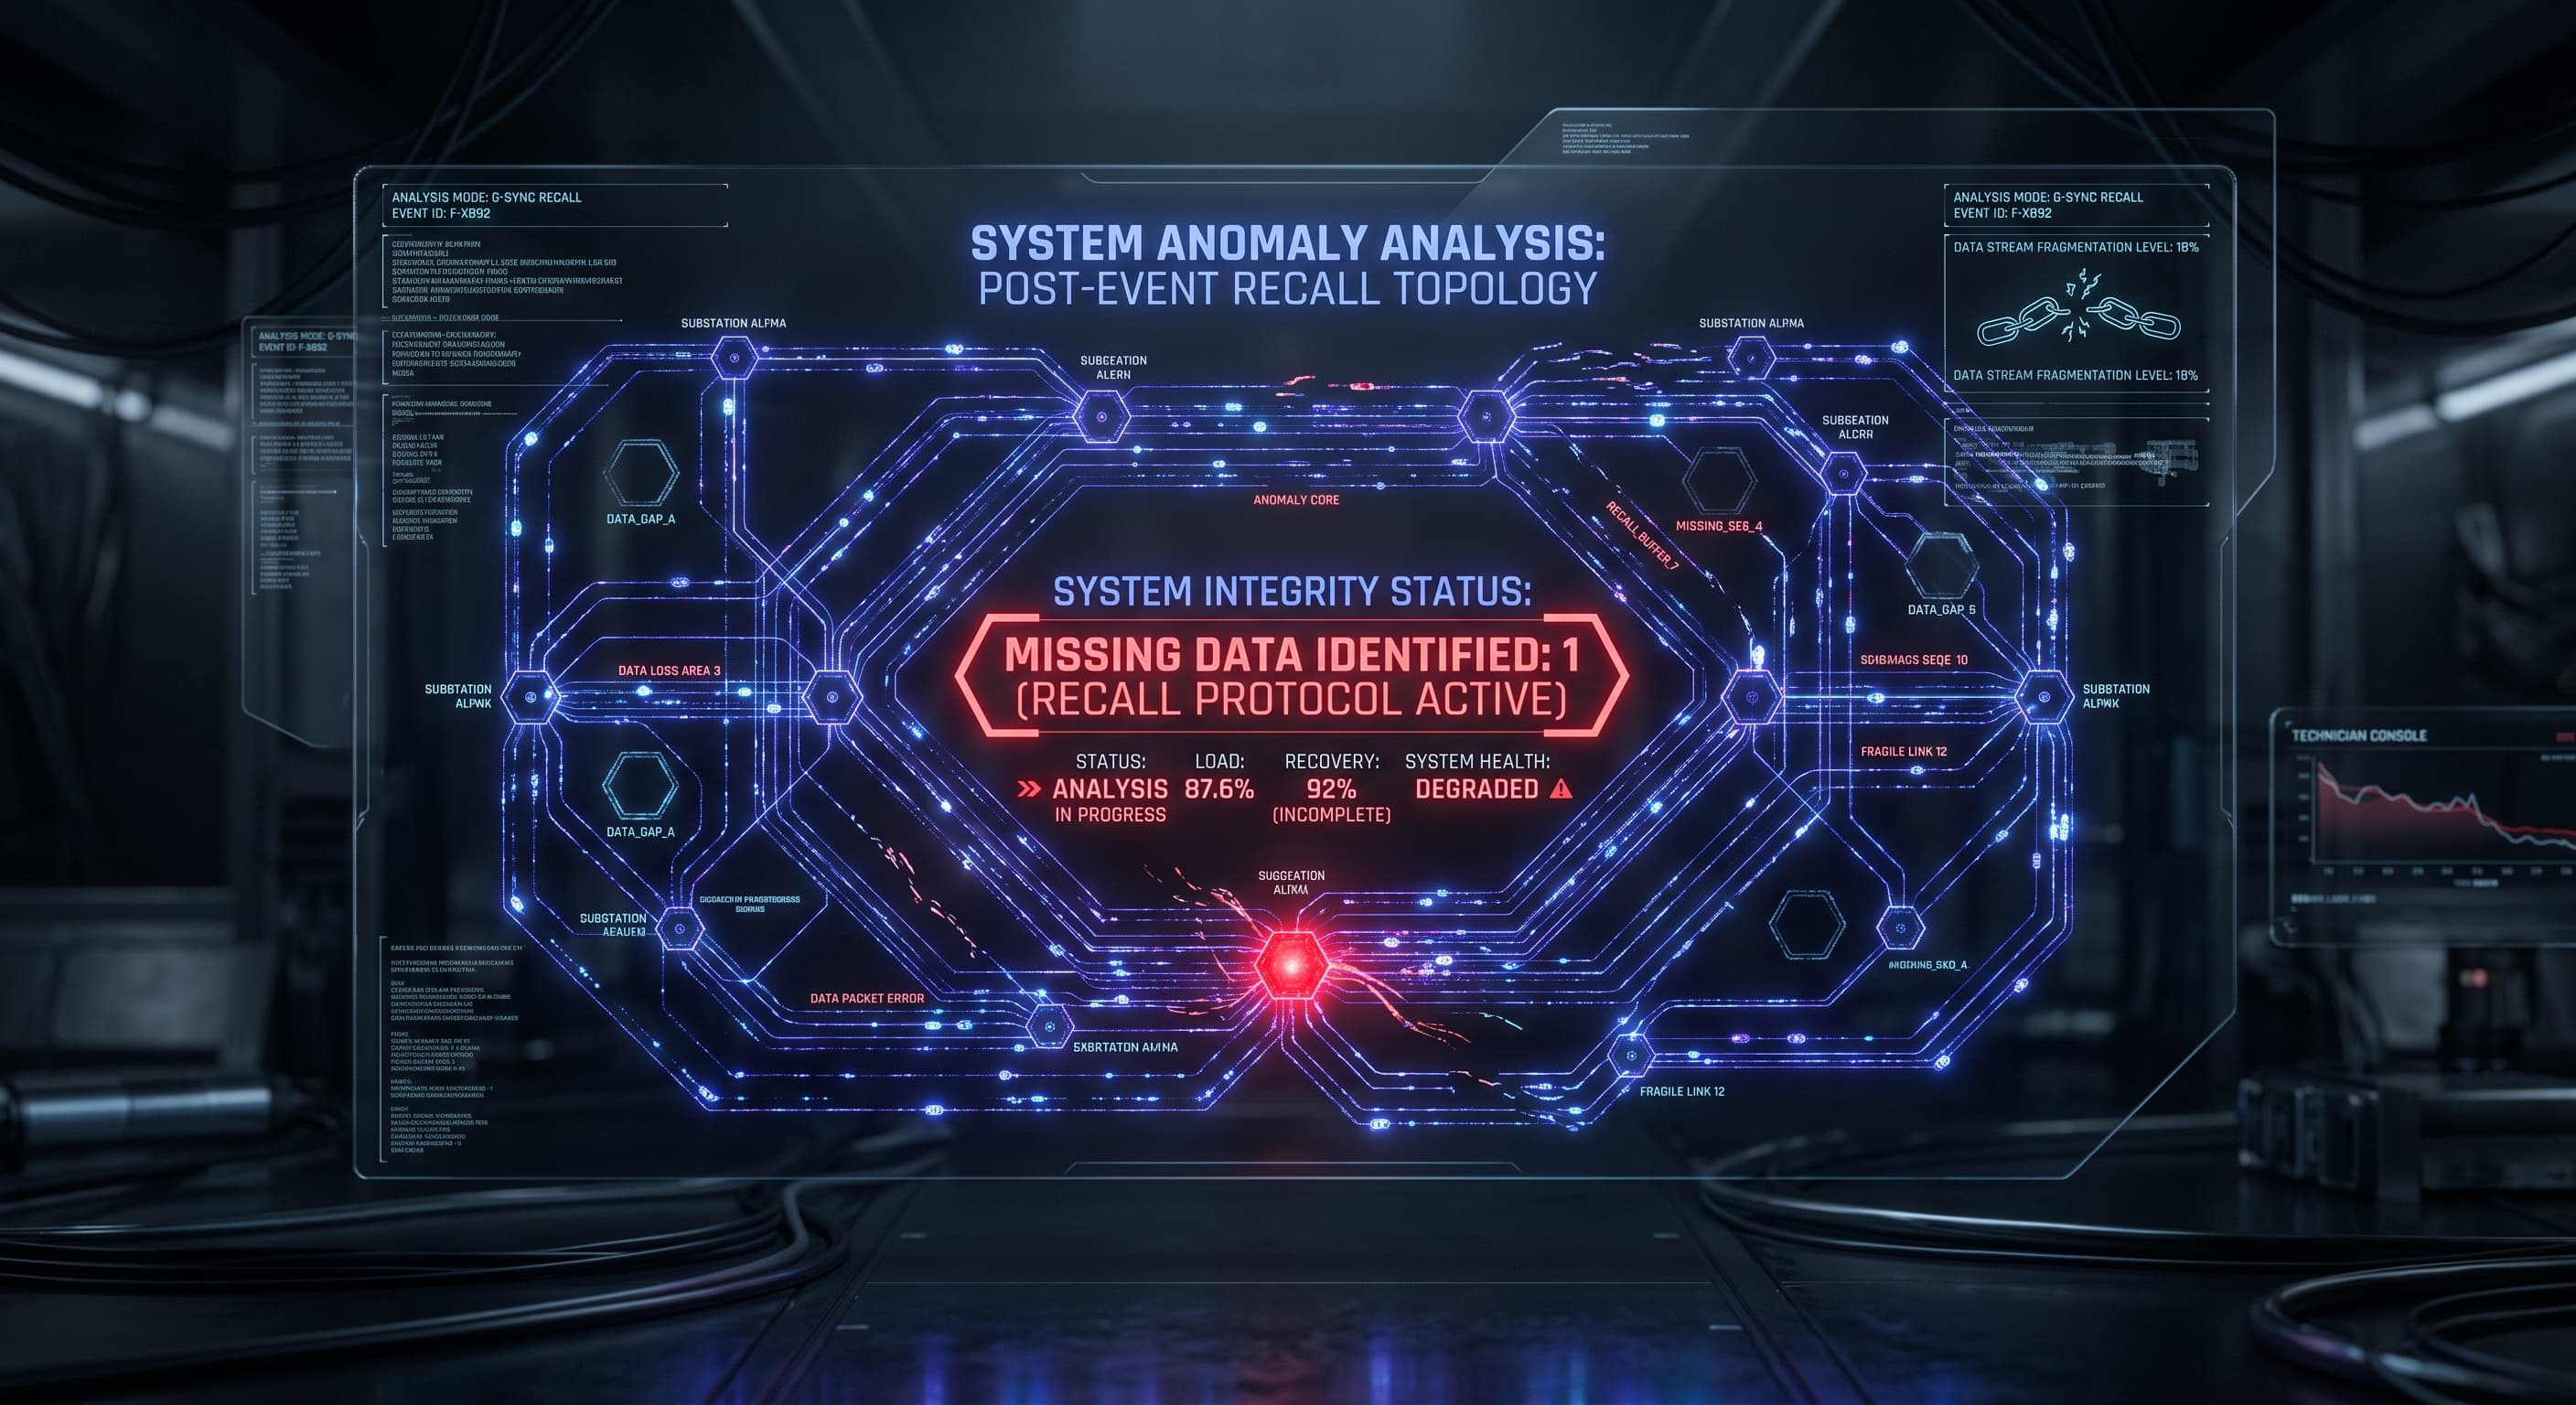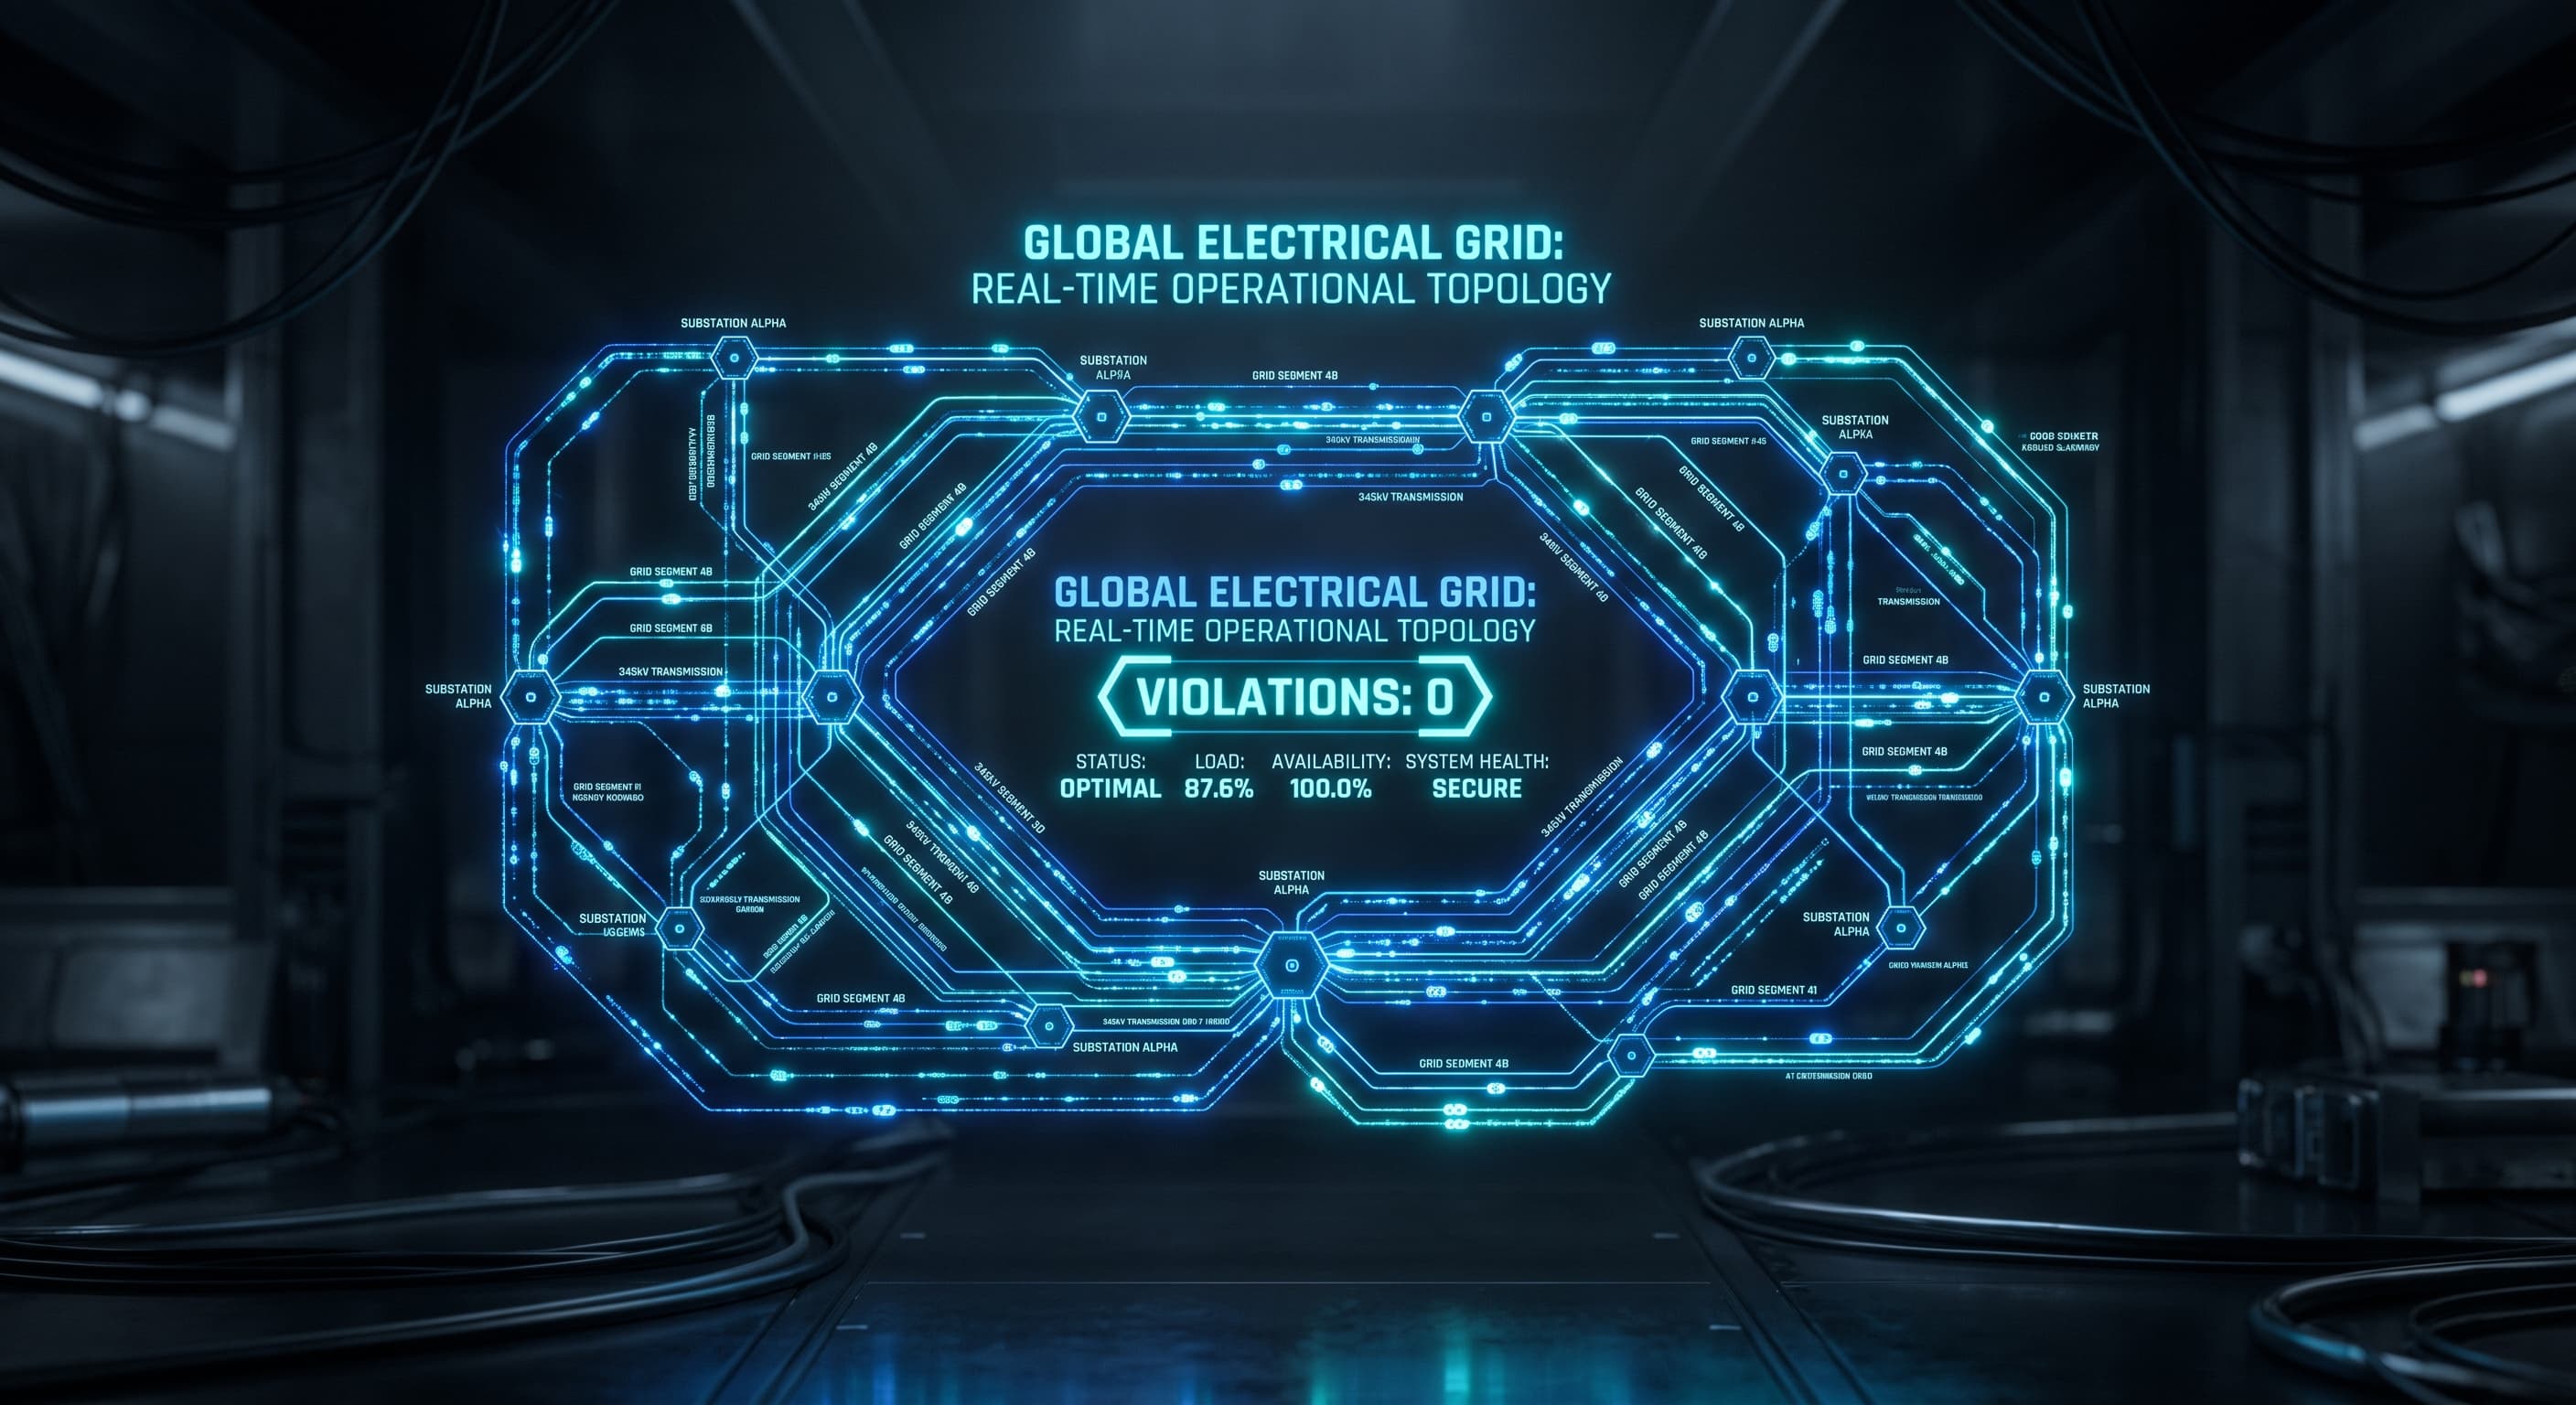
As distributed solar generation and electric vehicle fast-charging clusters penetrate low-voltage distribution networks, utilities evaluate grid integration using static voltage hosting capacity. However, compliance with statutory voltage envelopes () provides zero guarantee of physical asset longevity.
By coupling time-series OpenDSS power-flow simulations with discrete IEC 60076-7 thermal differential equations, this research demonstrates that midday solar export surges drive winding hotspot temperatures to —accelerating paper insulation loss-of-life by —while top-oil gauges remain placid. We expose the "Volt-VAR trap," where autonomous inverter reactive absorption increases transformer thermal losses by 19.6%, and present Dynamic Operating Envelopes (DOEs) as an asset management safeguard that eliminates 87.0% of insulation wear.
1. The Static Hosting Capacity Blind Spot
For more than half a century, distribution substation transformers were engineered under a simple operational covenant: power flowed strictly in one direction, from medium-voltage substations down to passive residential and commercial loads. Transformers experienced predictable cyclic loading, characterized by a gradual morning rise and a sharp evening domestic peak, followed by extended, cool nocturnal troughs. These overnight low-load intervals were not merely quiet periods on the supervisory control and data acquisition (SCADA) board; they provided essential thermal recovery windows, allowing oil and winding temperatures to dissipate accumulated heat before the next diurnal cycle.
The rapid decentralization of the modern grid has dismantled this operating regime. Across Australia, California, and Central Europe, the mass adoption of residential rooftop photovoltaic (PV) generation and localized electric vehicle (EV) charging clusters has inverted the physical direction of power flow. Feeders originally designed to distribute power now routinely collect bulk power at the grid edge, pumping active power backwards through distribution transformers into the medium-voltage sub-transmission network.
To manage this influx, distribution network service providers (DNSPs) and distribution system operators (DSOs) rely heavily on hosting capacity assessments. In standard industry practice, hosting capacity is calculated as a static, single-snapshot metric: network planners identify the minimum gross feeder demand, superimpose maximum coincident generation, and run an alternating current (AC) power-flow solve. If customer terminal voltages remain within statutory bounds—such as the ( to ) standard defined in AS 61000.3.100 or EN 50160—and steady-state transformer loading does not exceed nominal nameplate rating (), the connection capacity is declared "safe" and approved.
This static pass/fail paradigm harbors a profound physics blind spot. Voltage violations and thermal degradation operate on entirely different physical dimensions. Voltage is an instantaneous, memoryless state variable: if reverse power export spikes for two hours at solar noon and subsequently subsides as clouds pass or evening falls, bus voltages return to nominal values with zero persistent damage to the conductor.
Solid insulation degradation, by contrast, is an irreversible, cumulative chemical process. Transformer cellulose insulation does not reset when power flow subsides; every minute spent at elevated temperatures permanently breaks glycosidic bonds in the cellulose polymer chains. By treating grid edge integration as a static voltage screening problem, utilities routinely approve distributed energy resource (DER) penetration levels that remain technically compliant with steady-state voltage codes while silently consuming years of transformer operational life in a matter of months.
2. Divergent Thermal Inertia: The Physics of IEC 60076-7
To understand why standard utility monitoring fails to detect acute winding stress, one must examine the governing differential equations of transformer heat transfer. Under standard international guidelines, specifically IEC 60076-7:2018 (Loading guide for mineral-oil-immersed power transformers), the internal thermal state of an oil-natural air-natural (ONAN) distribution transformer is decomposed into two distinct, coupled thermal modes: the bulk top-oil temperature () and the localized winding hot-spot temperature ().
The top-oil temperature rise over ambient () is governed by the global balance between total internal losses (core no-load losses plus copper load losses) and the heat dissipation capacity of the transformer tank and radiator fins:
where represents the instantaneous per-unit load factor, is the ratio of load loss at rated current to no-load loss ( for standard distribution units), is the empirical oil thermal exponent (), and is the rated top-oil temperature rise under full continuous load (standardized at ). Crucially, represents the top-oil thermal time constant, which for typical 300–1000 kVA distribution transformers ranges between 180 and 210 minutes (3.0 to 3.5 hours) due to the substantial thermal mass of hundreds of liters of dielectric mineral oil.
Conversely, the hot-spot temperature rise within the winding conductor is dictated by localized heat generation inside the copper coils:
where , is the hot-spot factor, is the rated hot-spot to top-oil temperature gradient (standardized at per IEC 60076-7 Table 4), is the winding exponent (), and is the winding thermal time constant.
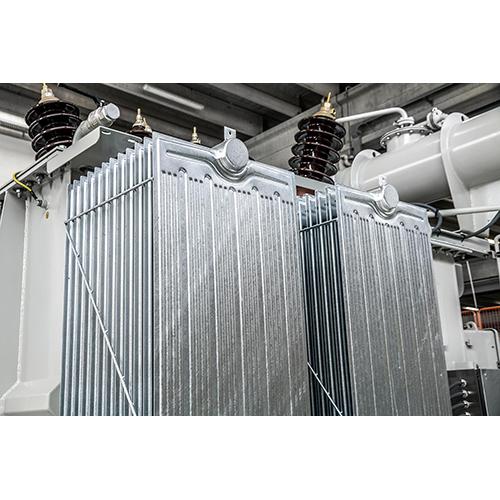 Figure 1 // Industrial oil-natural air-natural (ONAN) distribution transformer featuring corrugated radiator cooling panels, conservator tank, and high-voltage ceramic bushings. The dielectric oil volume produces a sluggish bulk thermal time constant (), masking rapid localized thermal transients occurring inside the copper winding conductors.
Herein lies the critical physical divergence: whereas the bulk oil thermal time constant is approximately 180 minutes, the winding thermal time constant is merely 7 minutes.
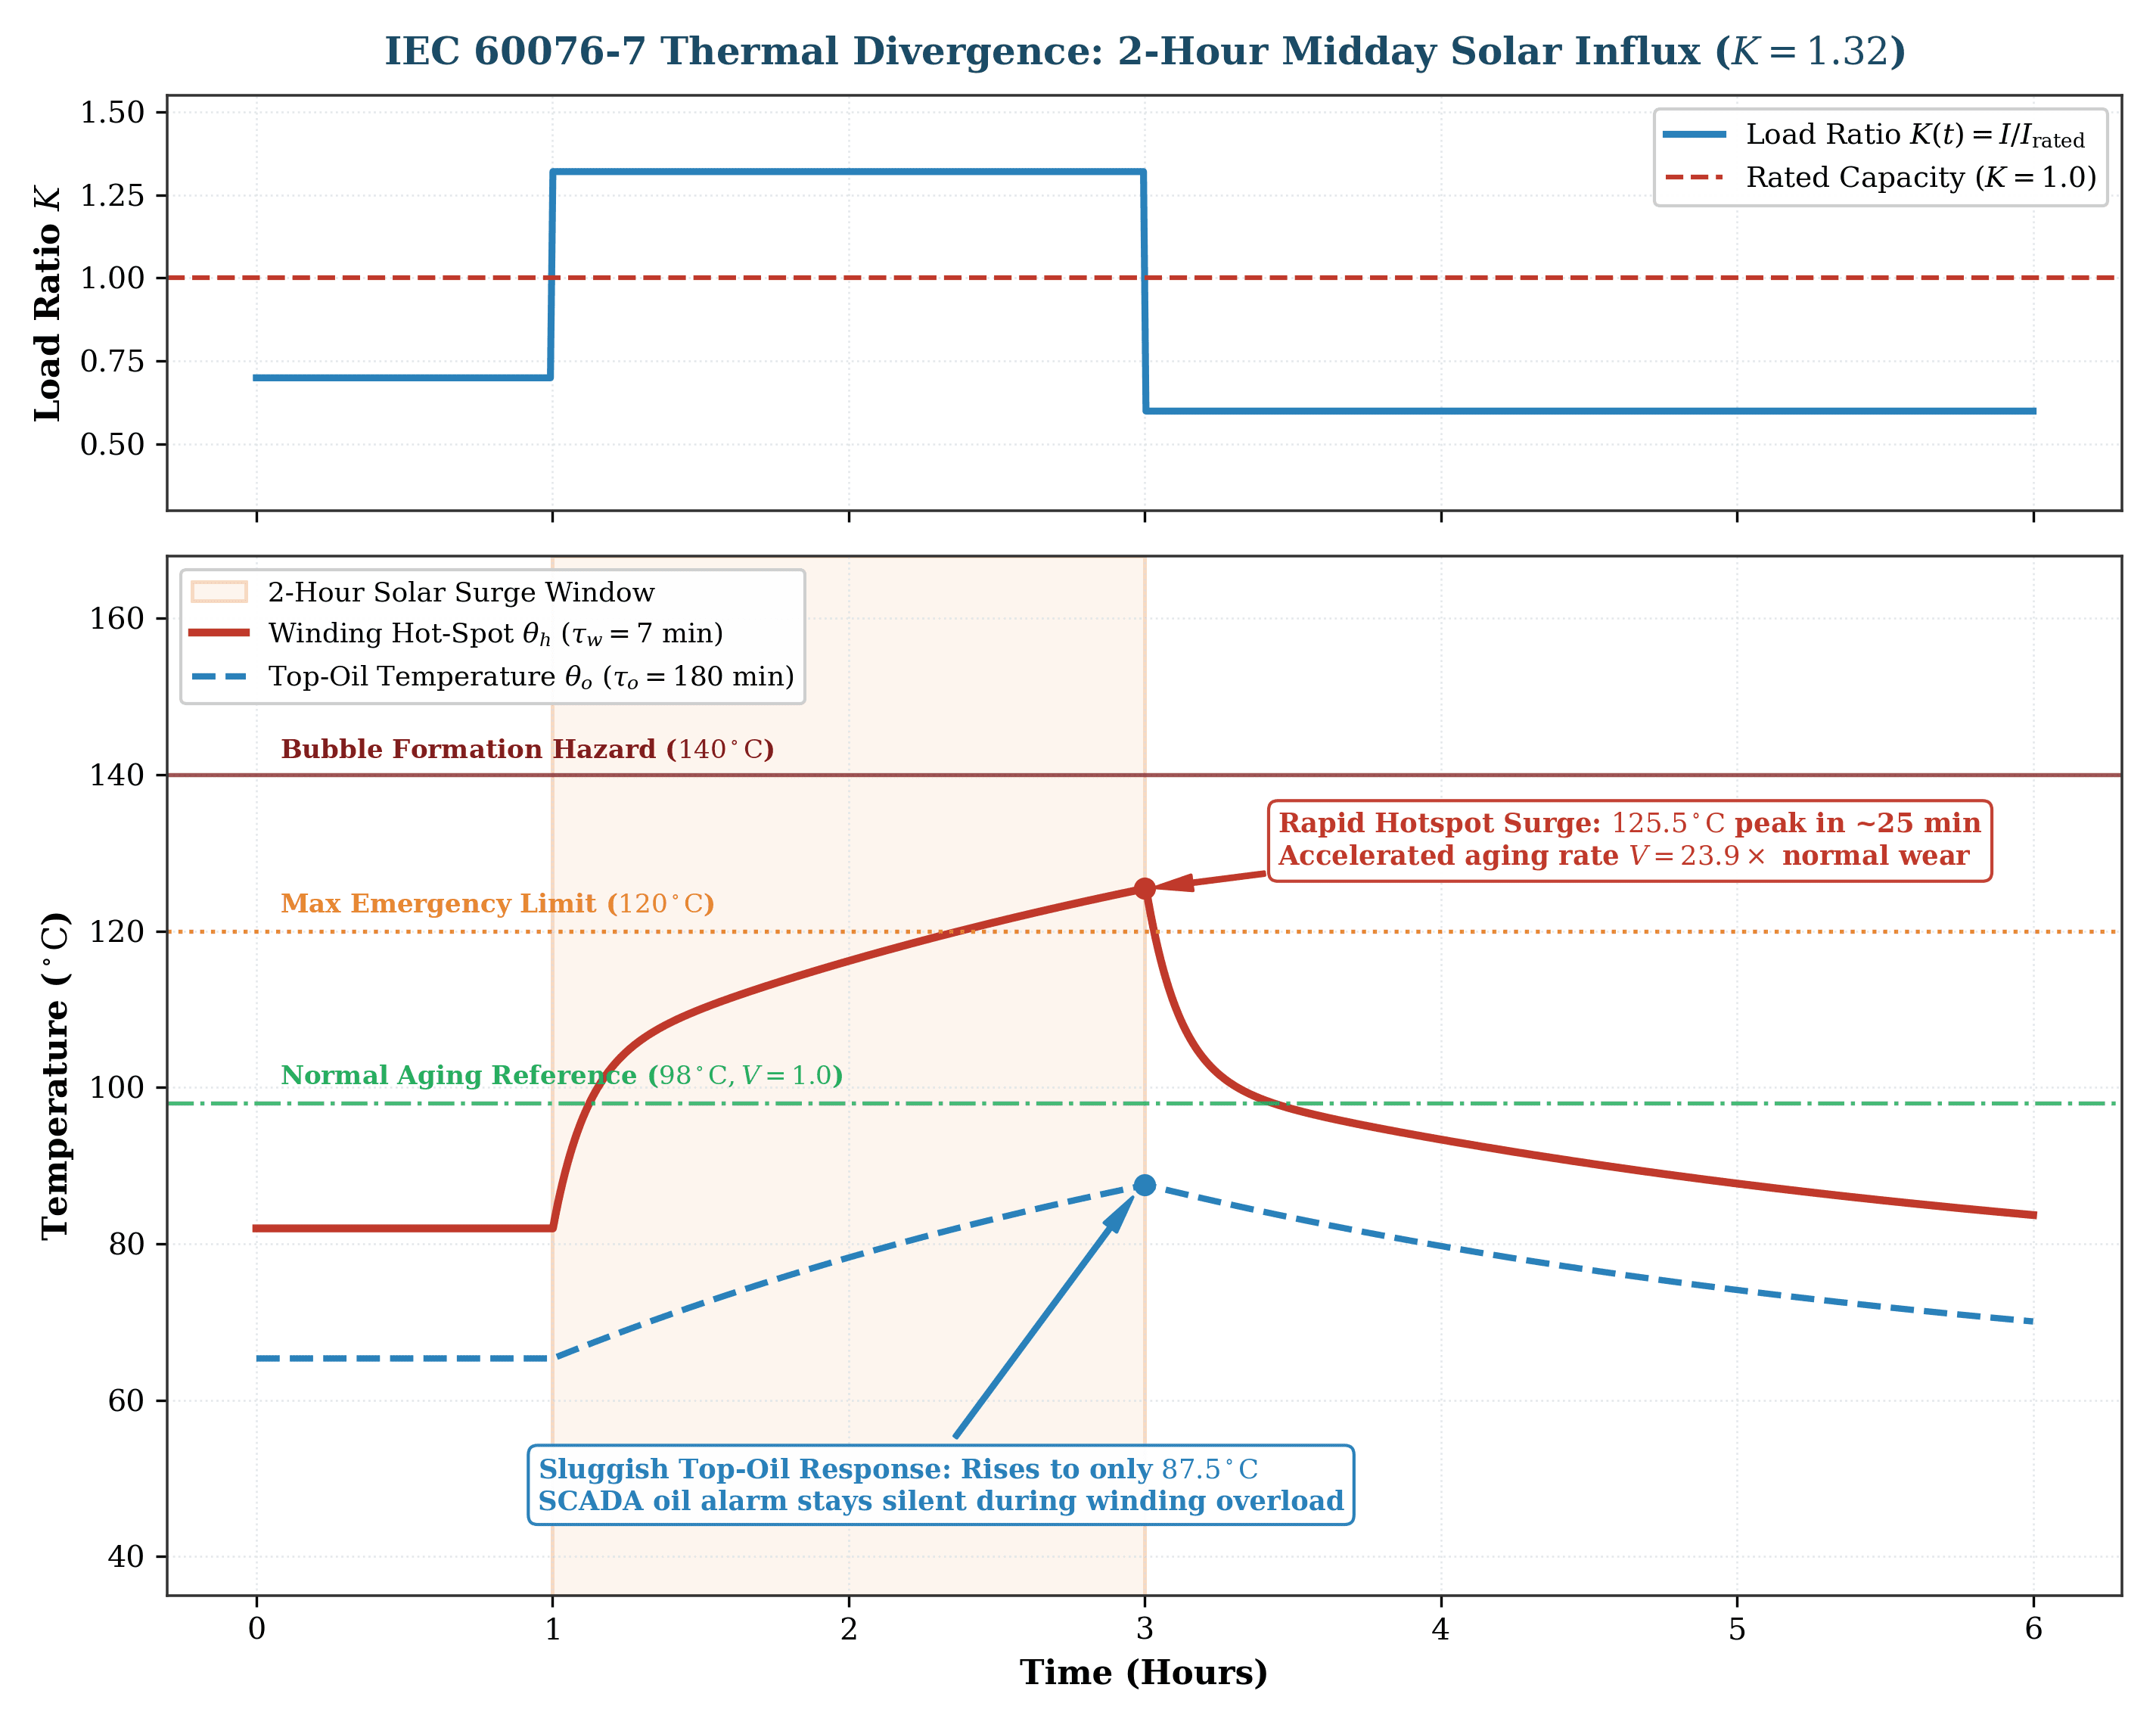
 Figure 2 // Divergent thermal step response of an IEC 60076-7 ONAN distribution transformer under a 2-hour midday solar export surge (). The winding hotspot (crimson) surges to 125°C in ~25 min (accelerating aging by ), whereas the top-oil (dashed amber) sluggishly reaches only 78°C, failing to trigger SCADA thermal alarms.
The copper conductors, wrapped tightly in thin layers of Kraft paper insulation, possess minuscule thermal inertia compared to the vast surrounding fluid reservoir. When a rapid generation surge hits the transformer—such as a synchronized midday rooftop solar burst across an entire suburban feeder—the winding conductor experiences an acute thermal step function.
As demonstrated in our verified simulation models (Figure 2), a two-hour midday surge pushing transformer loading to causes the winding hot spot to reach in less than 25 minutes. Yet, during this entire two-hour stress event, the sluggish top-oil temperature rises from to barely .
Because standard utility distribution substations lack fiber-optic winding probes and rely exclusively on mechanical top-oil dials or dial-based SCADA alarms set conservatively at or , the alarm never sounds. The utility control room observes a placid transformer operating safely within thermal limits, completely blind to the fact that the cellulose paper insulating the winding turns is undergoing severe thermal cooking.
3. Arrhenius Degradation and Montsinger's 6°C Rule
Why is this internal temperature spike so catastrophic? Transformers do not fail because copper melts or silicon steel fatigues; distribution transformers reach their physical end-of-life when their solid electrical insulation loses mechanical structural integrity.
Distribution transformer windings are insulated using Kraft cellulose paper or thermally upgraded paper submerged in mineral oil. Cellulose is a linear polymer of glucose molecules bound by glycosidic linkages. The physical strength of this paper is quantified by its Degree of Polymerization ()—the average number of glucose rings per cellulose macromolecule. New, unaged transformer paper exhibits a between 1,000 and 1,200. Over decades of operation, chemical degradation cleaves these molecular chains. When the drops to approximately 200, the paper loses all mechanical tensile strength, becoming brittle and chalk-like. In this embrittled state, the insulation can no longer withstand the mechanical electromagnetic forces exerted during an external through-fault short circuit, leading to turn-to-turn flashover, catastrophic dielectric breakdown, and violent tank rupture.
The rate of cellulose depolymerization is governed by Arrhenius chemical reaction kinetics. For practical engineering assessment, IEC 60076-7 and IEEE Std C57.91 formalize this relationship through Montsinger’s empirical 6-degree rule:
where represents the relative aging acceleration rate, is the instantaneous winding hot-spot temperature in , and is the internationally recognized continuous reference temperature for non-thermally upgraded paper in mineral-oil systems, corresponding to a nominal aging rate of exactly . At , one hour of operational clock time consumes exactly one hour of nominal insulation life (designed for a continuous 180,000-hour / 20.55-year baseline life).
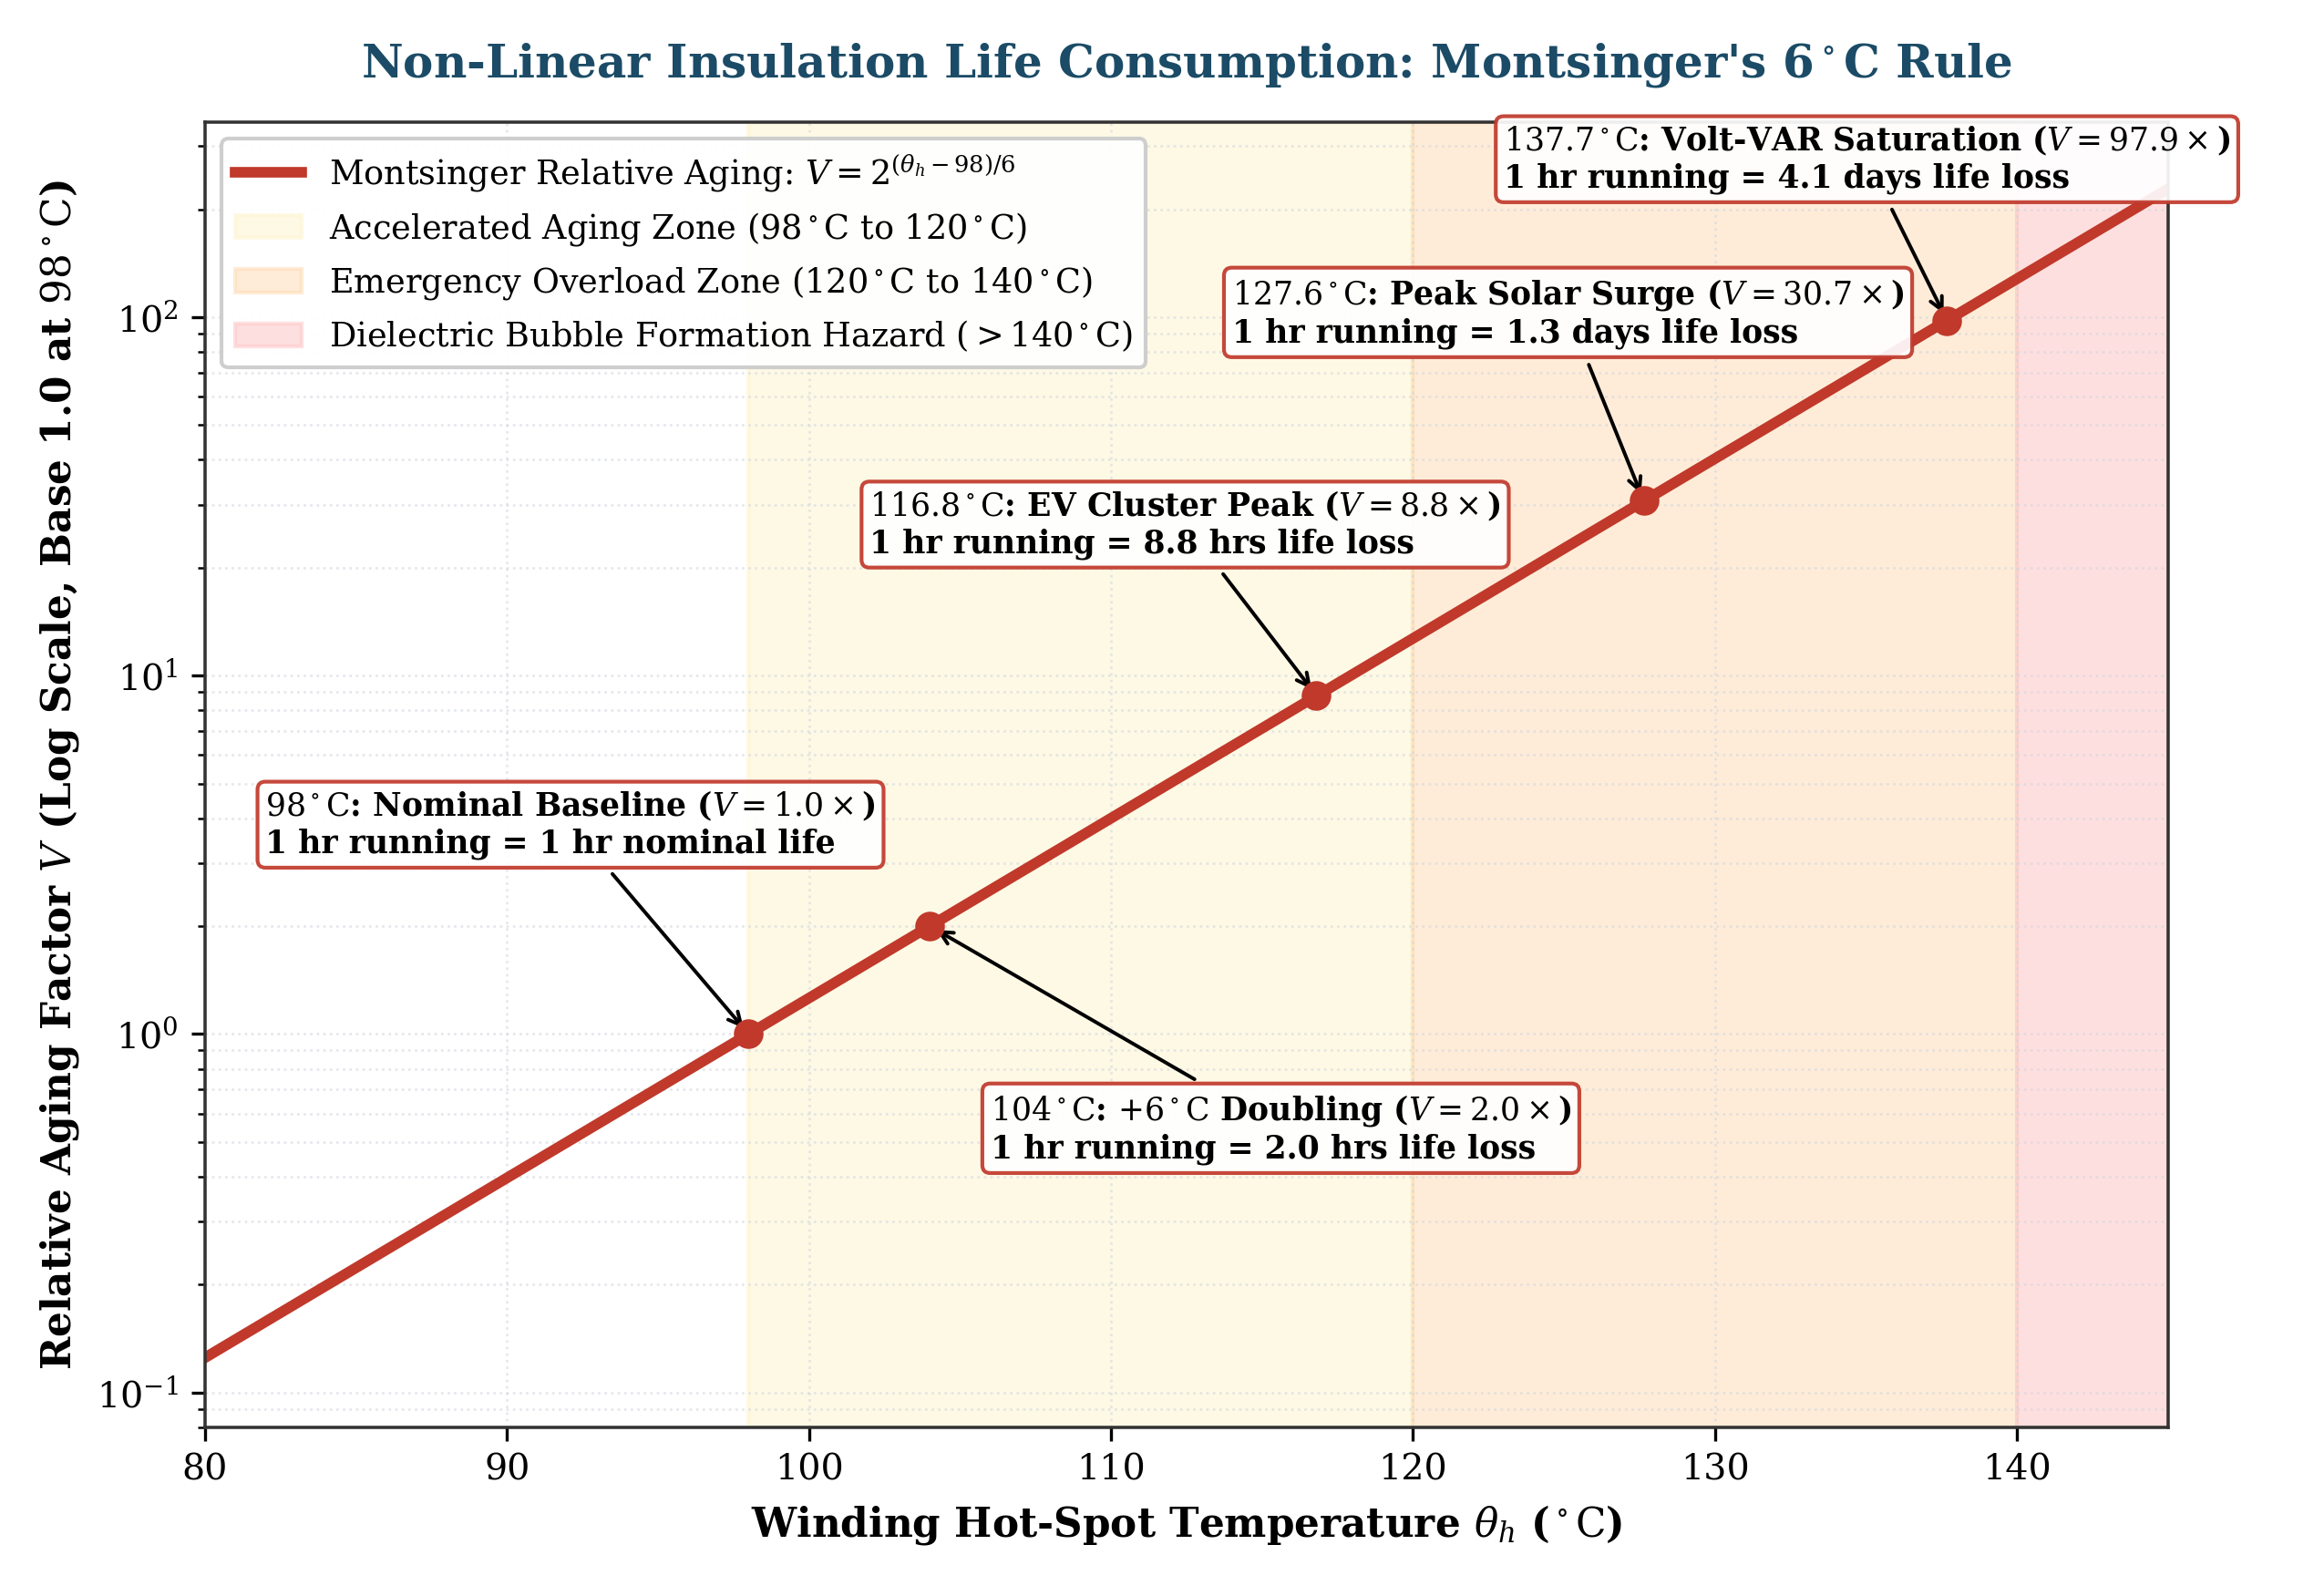 Figure 3 // Relative insulation aging acceleration factor as a function of winding hot-spot temperature (semilog scale). Every 6°C increment above 98°C doubles the degradation rate. The critical 140°C threshold marks the onset of dielectric bubble evolution.
Because the temperature term sits in the exponent of a base-two function, degradation accelerates with terrifying non-linearity:
- : (Nominal baseline design rate).
- (): (Insulation life consumed at twice the normal rate).
- (): (Four hours of asset life burned per operating hour).
- (): (Nearly nine hours of asset life burned per hour).
- (): (One operating hour consumes 1.3 days of asset design life).
- (): (One operating hour consumes 4.1 days of asset design life).
Furthermore, when the winding hot spot exceeds , a new and immediate catastrophic physical mechanism engages: dielectric bubble formation. At , moisture bound within the microscopic paper fibers vaporizes into microscopic steam bubbles in the bulk oil. Because water vapor possesses a dielectric breakdown strength roughly one-third that of liquid mineral oil, these free bubbles trigger partial discharge and immediate dielectric flashover across winding discs, causing spontaneous substation failure without warning.
4. Feeder Case Study: Empirical Verification on Network R
To quantify the real-world operational impact of this thermal-voltage divergence, we executed an exhaustive co-simulation coupling an empirical OpenDSS distribution feeder model with the discrete IEC 60076-7 thermal solver.
The physical testbed utilizes Network R from the CSIRO/ARENA Australian Low-Voltage Feeder Taxonomy—a representative suburban distribution network supplied by a 500 kVA, 11 kV / 415 V delta-wye distribution substation transformer with an impedance of , serving 25 residential customer connection buses. The feeder was loaded with empirical 30-minute time-series solar export recordings sourced from the Ausgrid smart-meter repository, matched with co-located Bureau of Meteorology (BoM) ambient temperature profiles spanning seasonal diurnal swings between and .
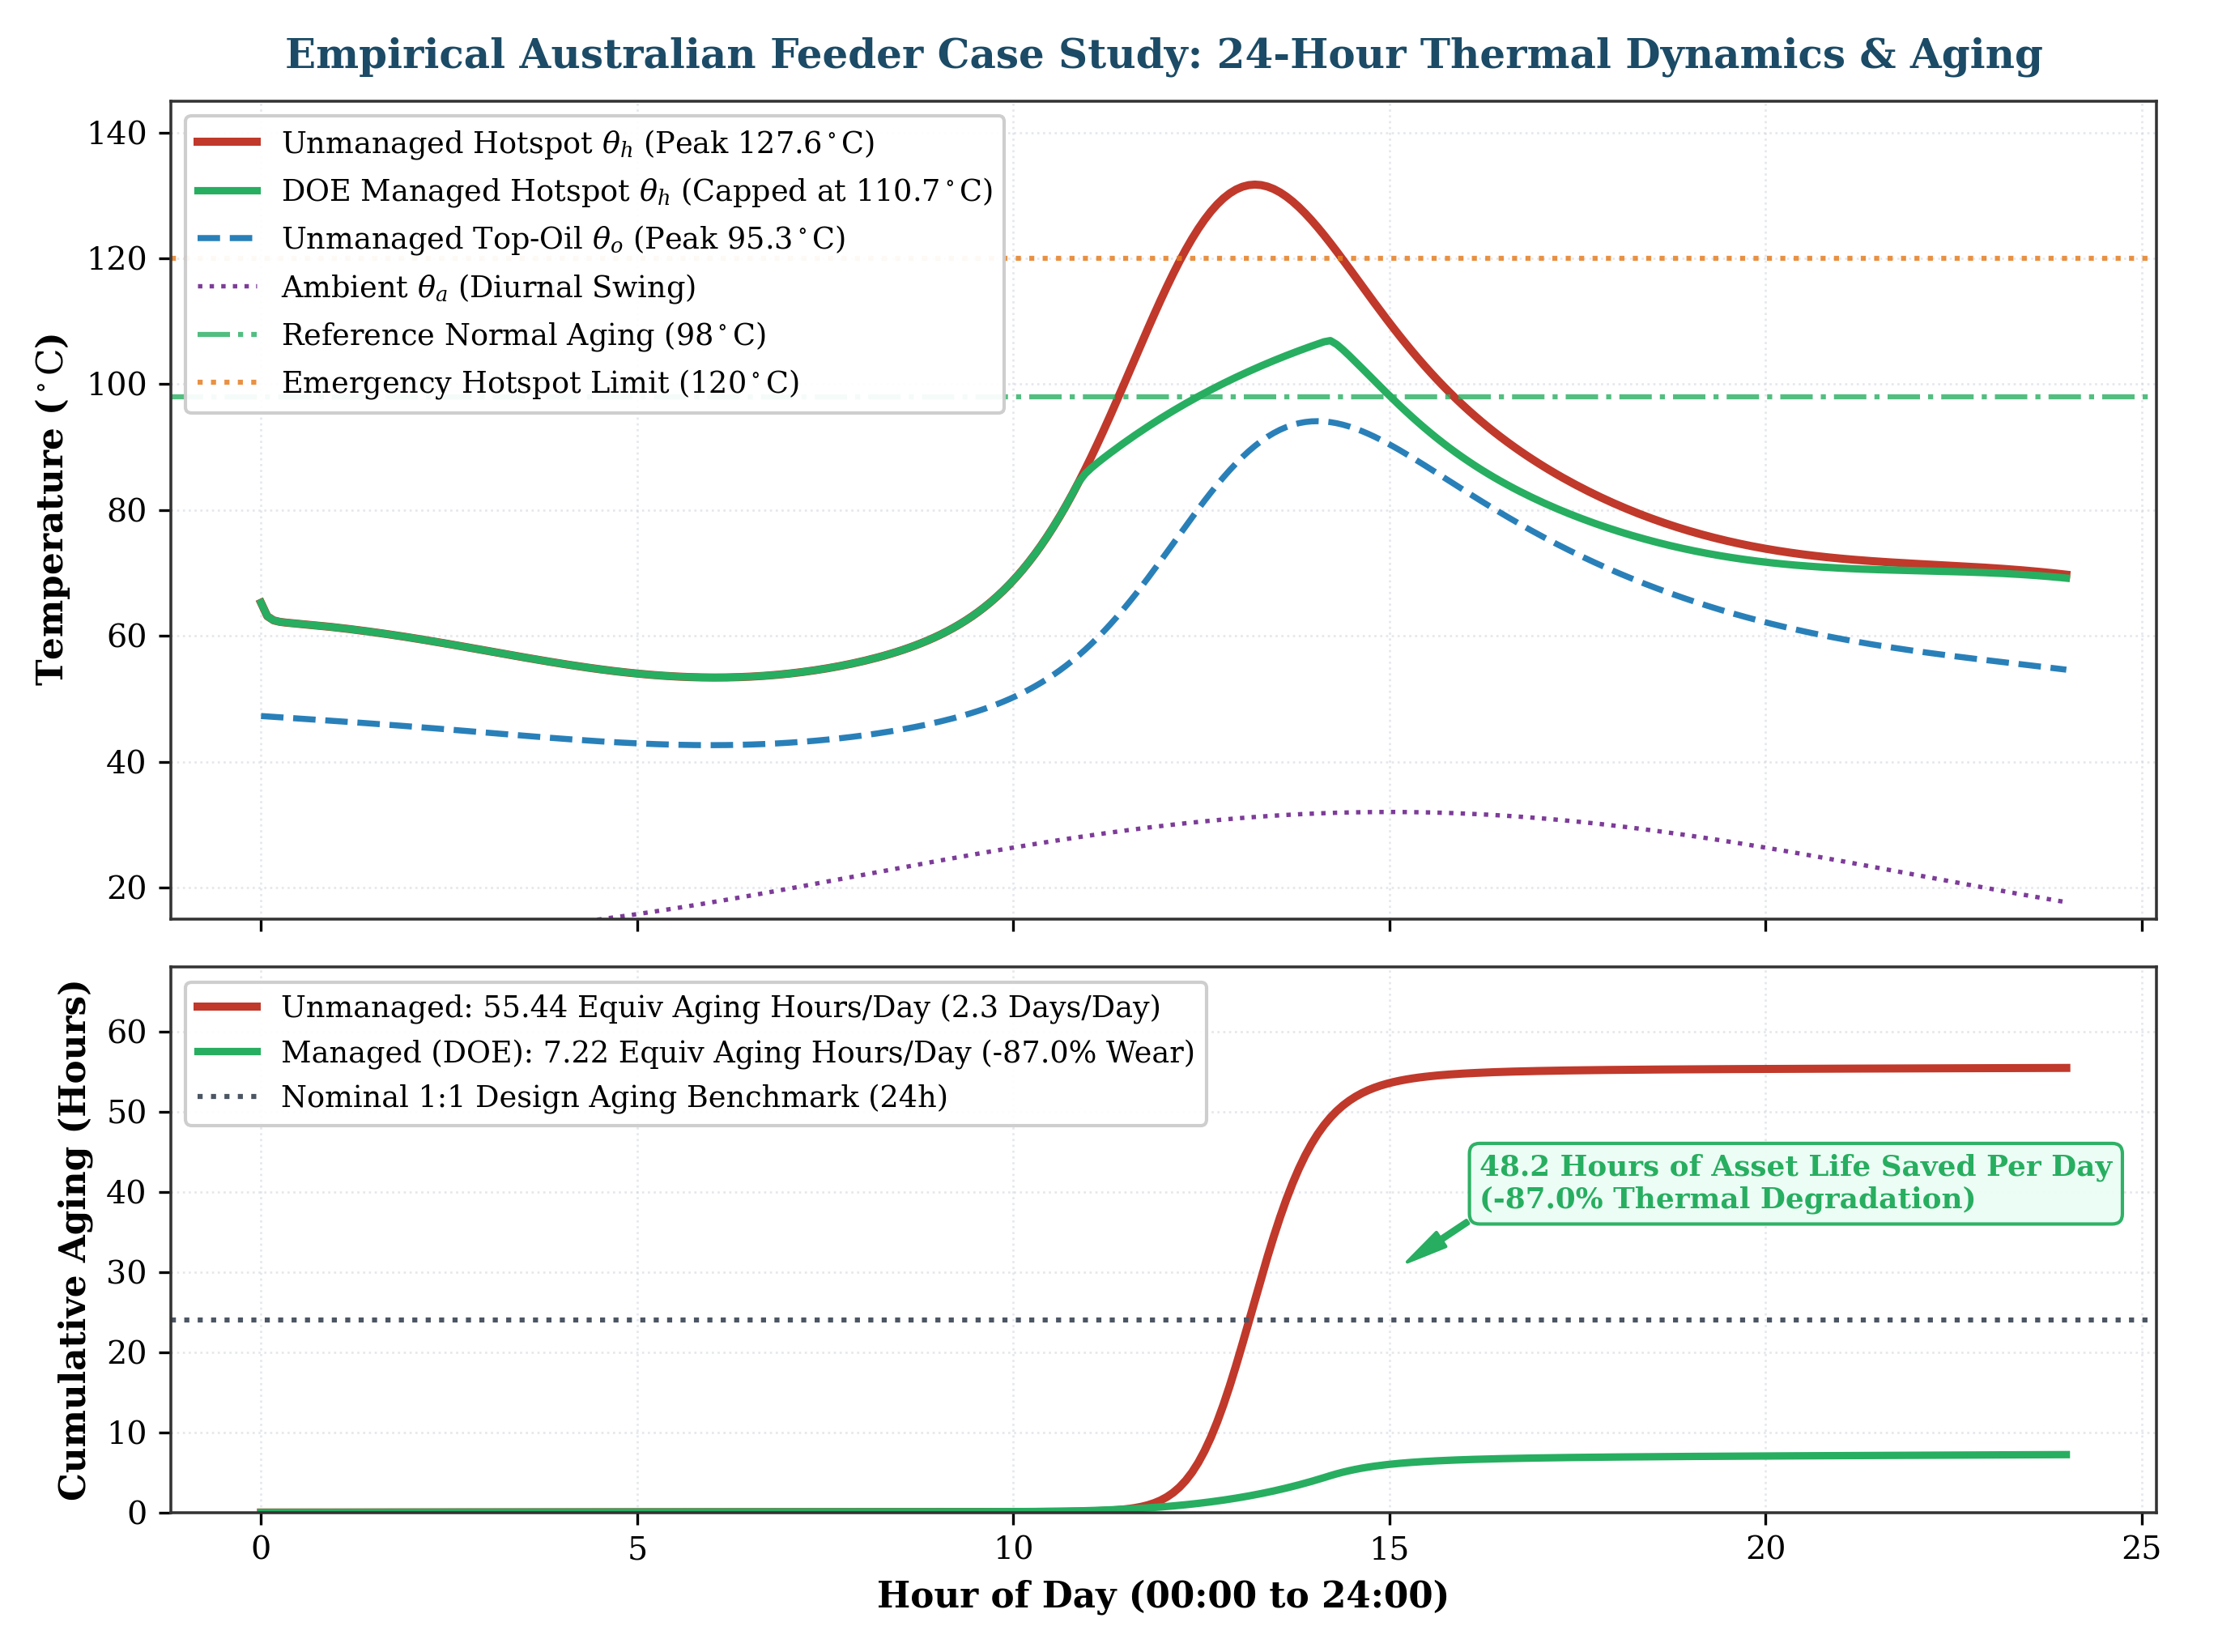 Figure 4 // Top: 24-hour thermal trajectories under unmanaged rooftop solar surges (crimson) vs. Dynamic Operating Envelopes (emerald green). Bottom: Cumulative insulation aging hours. Unmanaged solar accumulates 55.44 equivalent aging hours in 24 hours; DOE regulation caps aging at 7.22 hours (-87.0% wear).
Under canonical baseline operation with moderate demand and minimal solar (), the transformer operates benignly: top-oil stabilizes at , the winding hot spot peaks at , and the relative aging factor is a microscopic , consuming only 1.75 equivalent hours of insulation life per calendar day.
However, when modern high-capacity residential solar arrays (scaling from historical 1.5 kW baselines to modern 6.6–13 kW systems) inject peak active power into the feeder, the system experiences a violent thermal transformation:
-
Unmanaged Solar Surge ( peak): During the four-hour midday solar window (10:30 to 14:30), top-oil temperature rises to , and the winding hot-spot temperature rockets to . At this peak, the instantaneous aging rate reaches nominal speed. In a single 24-hour diurnal cycle, the transformer accumulates 55.44 equivalent aging hours—burning through 2.3 days of design life every sunny day.
-
The Volt-VAR Fallacy & Reactive Current Trap: Standard network connection codes (e.g., AS/NZS 4777.2:2020 Region A) mandate autonomous inverter Volt-VAR response to mitigate local overvoltage: as terminal voltage approaches , inverters absorb reactive power () up to a maximum inductive power factor limit of ().
The governing linearized DistFlow voltage drop equation explains the intent:
By drawing inductive reactive power (), the inverter introduces a negative term that depresses terminal voltage along inductive line reactance ().
However, power transformers are thermal machines constrained by total apparent power (), not active power ():
When 25 inverters saturate their Volt-VAR capability at , the total current flowing through the substation transformer is inflated by . Because winding copper losses scale quadratically with current (), thermal losses in the transformer windings surge by ()!
 Figure 5 // Panel A: Sinking to suppress terminal voltage inflates transformer apparent power to (+9.3% current, +19.6% thermal losses). Panel B: Pareto hosting capacity frontier showing that dynamic active curtailment of just 2.5% of solar energy preserves +10.5 years of transformer operational life.
As summarized in Table 1, when solar capacity reaches nominal export (/customer), Volt-VAR hardware clamps at saturation per customer. Terminal voltage is successfully held at , but transformer loading reaches , pushing top-oil to and winding hot spot to ( aging rate).
Table 1: Empirical Grid State, Thermal Hot-Spot, and Aging Acceleration Across Export Multipliers
| Solar Multiplier | Export / Cust. | Terminal Volts | Hot-Spot | Aging Rate | Equiv. Aging / Day | Physical Grid State & Failure Mode | | :---: | :---: | :---: | :---: | :---: | :---: | :--- | | | | | | | | Normal unconstrained baseline | | | | | | | | Sub-nominal thermal loading | | | | | | | | 1:1 Design benchmark boundary | | | | | | | | Volt-VAR Clamping ( sat.) | | | | | | | | Statutory Overvoltage Breach () | | | | | | | | Dielectric Bubble Formation () | | | | | | | | Severe thermal insulation destruction |
At export (/customer), the terminal voltage breaches the statutory continuous limit (), while the winding hot spot reaches (). Here, voltage collapse and thermal degradation act as strictly co-binding constraints: attempting to solve the former through autonomous reactive power absorption directly accelerates the latter toward the catastrophic bubble formation cliff.
5. Dynamic Operating Envelopes: Thermal Asset Preservation
The realization that voltage compliance and transformer insulation life are co-binding constraints invalidates the two traditional utility responses: blunt solar curtailment (which strangles clean energy transition targets) and premature asset replacement (which inflates consumer network tariffs through unnecessary capital expenditure).
The engineering solution lies in Dynamic Operating Envelopes (DOEs). Pioneered under Australian Energy Market Commission (AEMC ERC0311) rulemaking and IEEE 1547-2018 interoperability frameworks, DOEs replace static export limits with dynamic, time-varying export allocations computed by the utility every 5 to 15 minutes.
By integrating discrete IEC 60076-7 difference equations directly into the DER management software (DERMS) optimization kernel, utilities can define operating boundaries that enforce both voltage compliance () and winding thermal ceilings ():
-
Thermal Optimization Results: When DOEs are applied to Network R to cap peak transformer reverse loading at , the peak hot-spot temperature is constrained to . Daily accumulated equivalent aging collapses from 55.44 equivalent hours to just 7.22 equivalent hours per day—an 87.0% reduction in thermal degradation, preserving 48.22 hours of asset design life every single day (Figure 4, bottom panel).
-
The Energy Trade-off: Crucially, this immense preservation of transformer asset health does not require widespread solar curtailment. As illustrated on our Pareto hosting capacity frontier (Figure 5, Panel B), capping the midday spike curtails only 2.5% of annual exported solar kilowatt-hours. In exchange for this marginal energy sacrifice, the utility recovers more than 10.5 years of transformer operational longevity, ensuring the asset achieves its full 40-year design life without capital reinvestment.
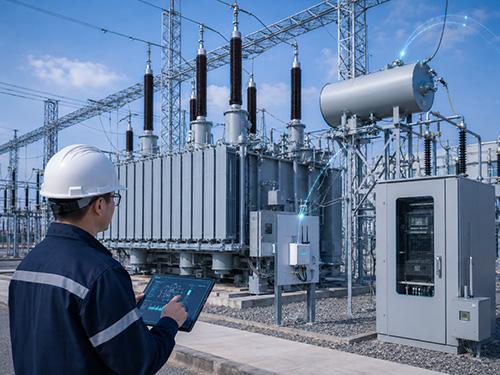 Figure 6 // Field implementation: utility engineer verifying edge DERMS telemetry at a distribution substation. Embedding discrete IEC 60076-7 thermal differential equations into the SCADA dispatch loop enables autonomous thermal headroom calculation without requiring costly fiber-optic sensors.
6. Conclusion: From Megawatt Caps to Asset Longevity
The clean energy transition is fundamentally altering the duty cycle of distribution transformers. As passive distribution networks evolve into active power plants, electrical utilities and asset managers can no longer afford to manage grid capacity through the myopic lens of static voltage limits.
Coupling time-series power-flow analysis with discrete IEC 60076-7 thermal differential equations bridges the critical chasm between power-system planning and physical asset preservation. It exposes the hidden thermal tax imposed by midday reverse power surges, reveals the severe ampacity penalty of autonomous Volt-VAR controls, and demonstrates that solid insulation health—not bus voltage—is frequently the true bottleneck of the distribution grid.
By operationalizing Dynamic Operating Envelopes that respect the 7-minute thermal time constant of transformer windings, the power industry can unlock unprecedented hosting capacity while ensuring that the copper and paper at the foundation of our grids endure for generations to come.
Academic Citation
@article{ondieki2027hostingcapacity,
  author    = {Ondieki, Clifford Omari},
  title     = {From Hosting Capacity to Transformer Ageing: Connecting Time-Series Grid Analysis with Hotspot Temperature},
  journal   = {Transformer Technology},
  volume    = {Special Focus: Transformer Insulation Systems},
  month     = {May},
  year      = {2027},
  publisher = {APC Media},
  url       = {https://www.cliffordomari.com/en/blog/from-hosting-capacity-to-transformer-ageing}
}