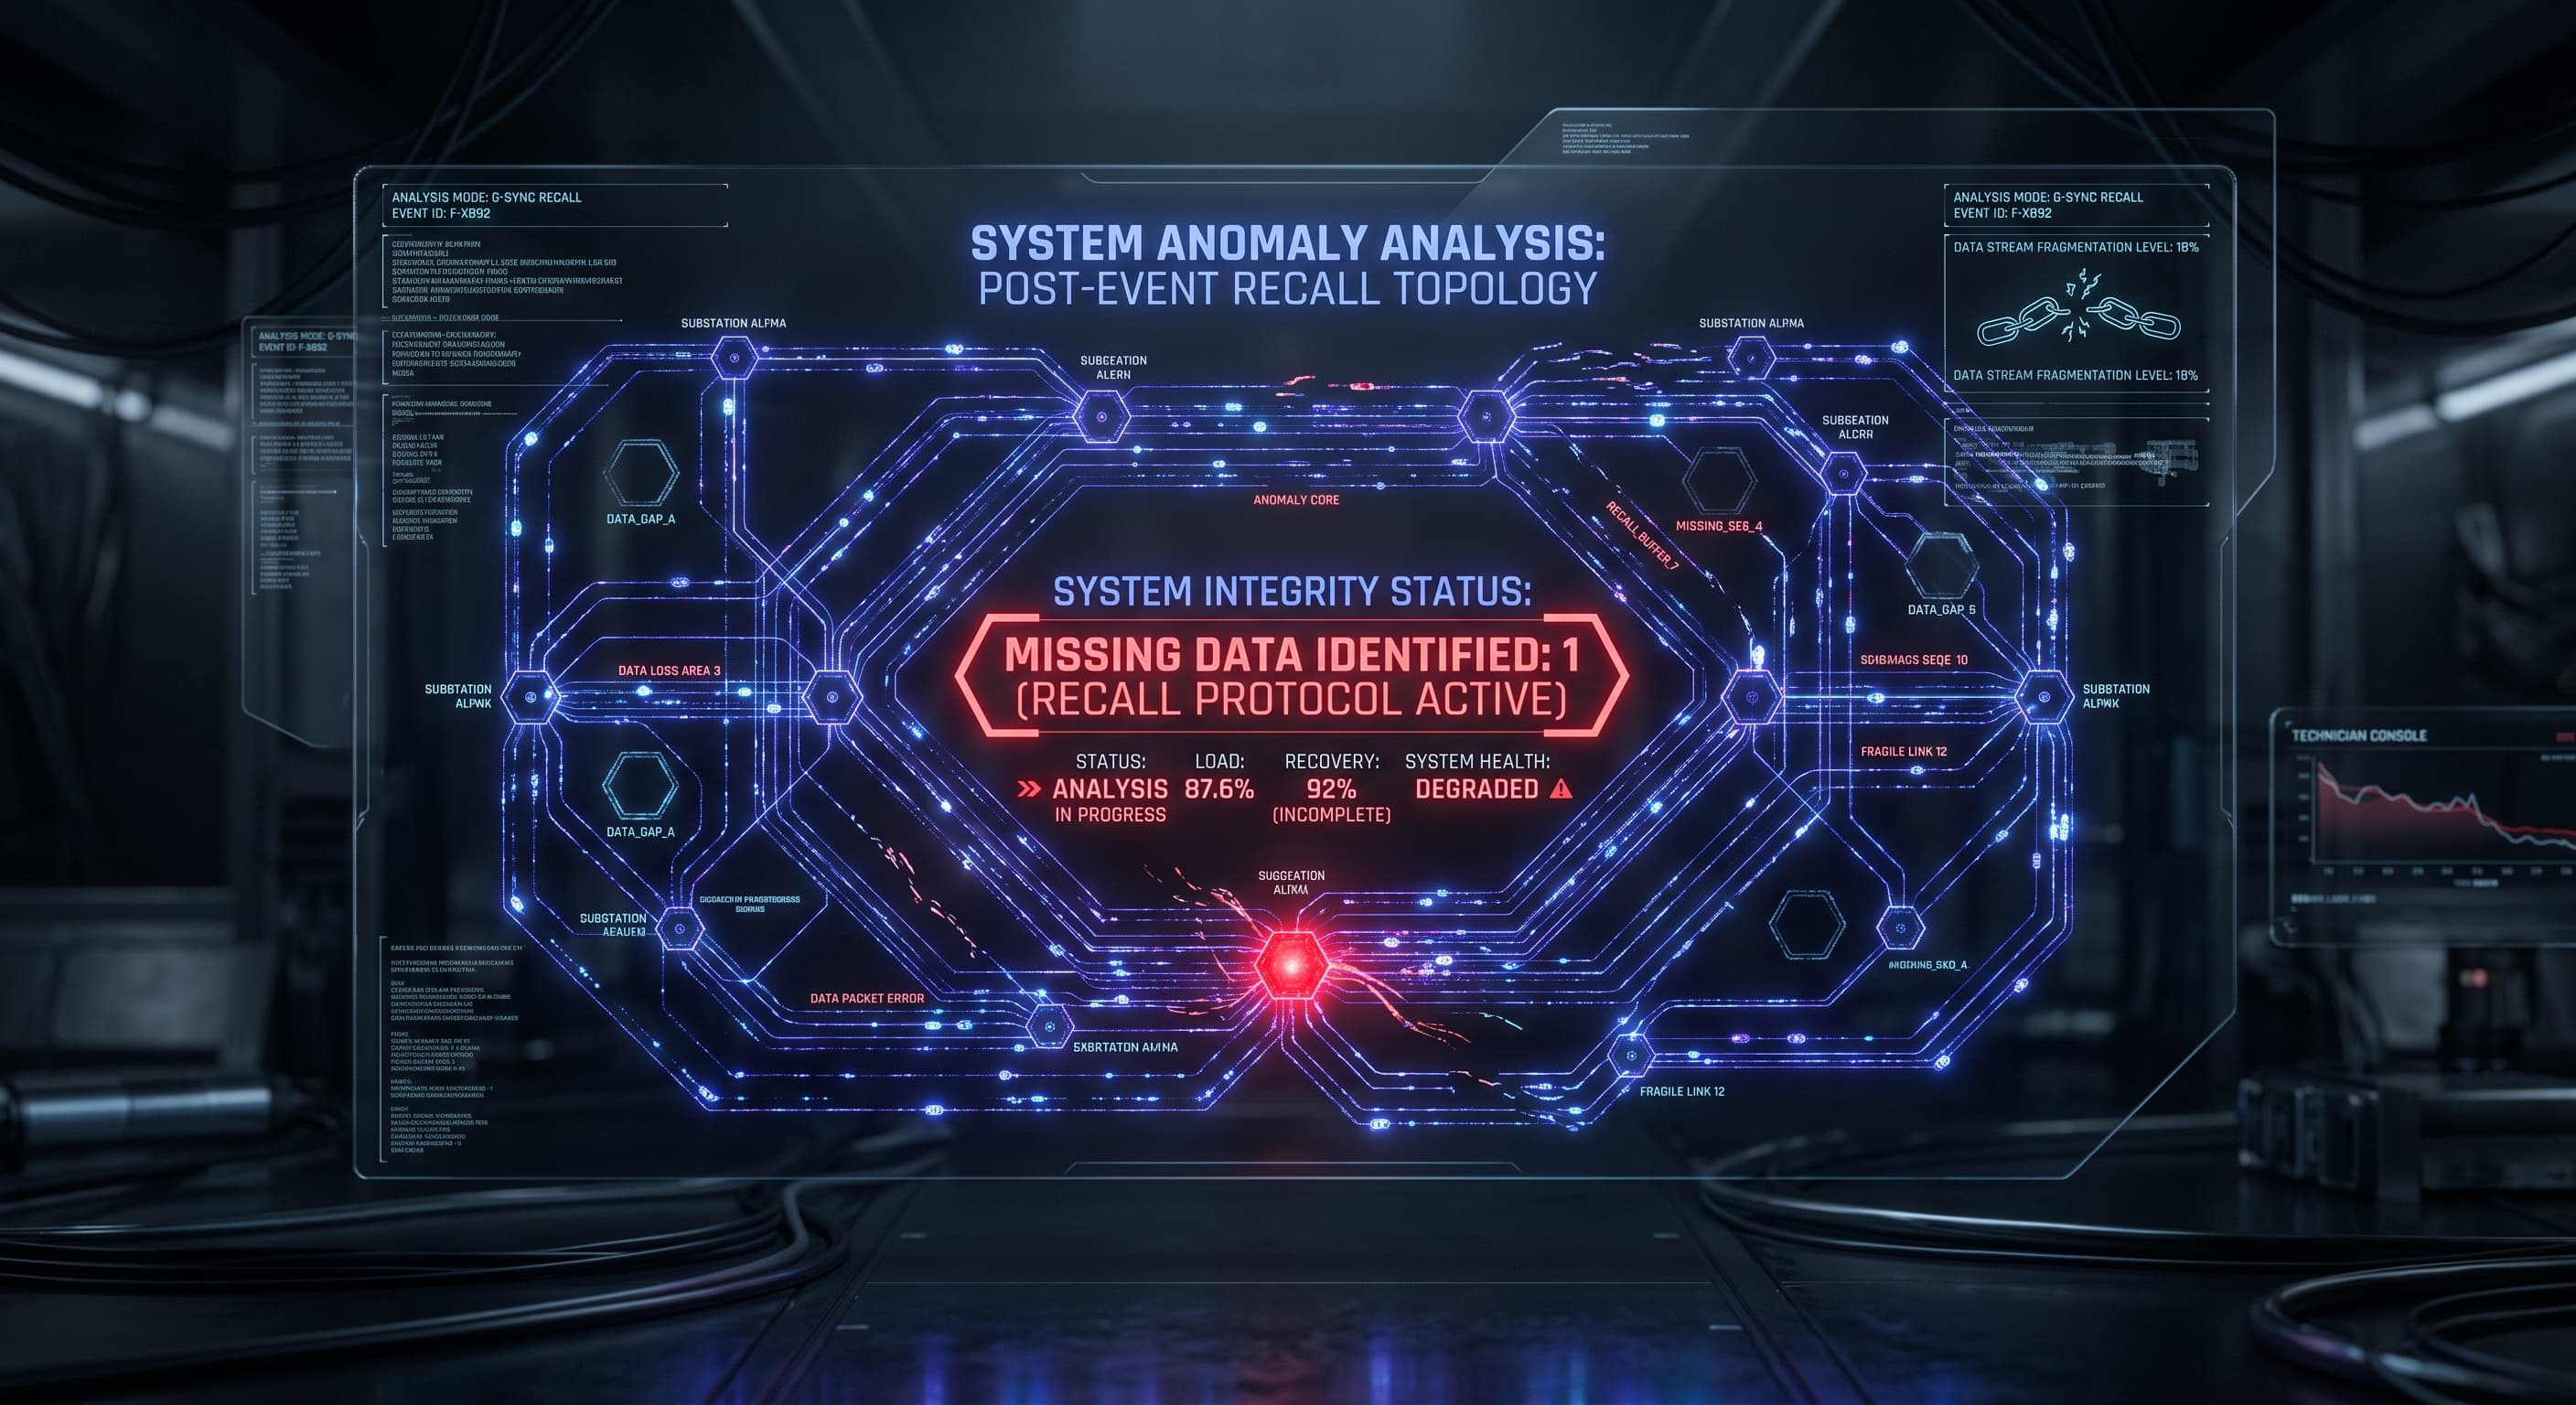
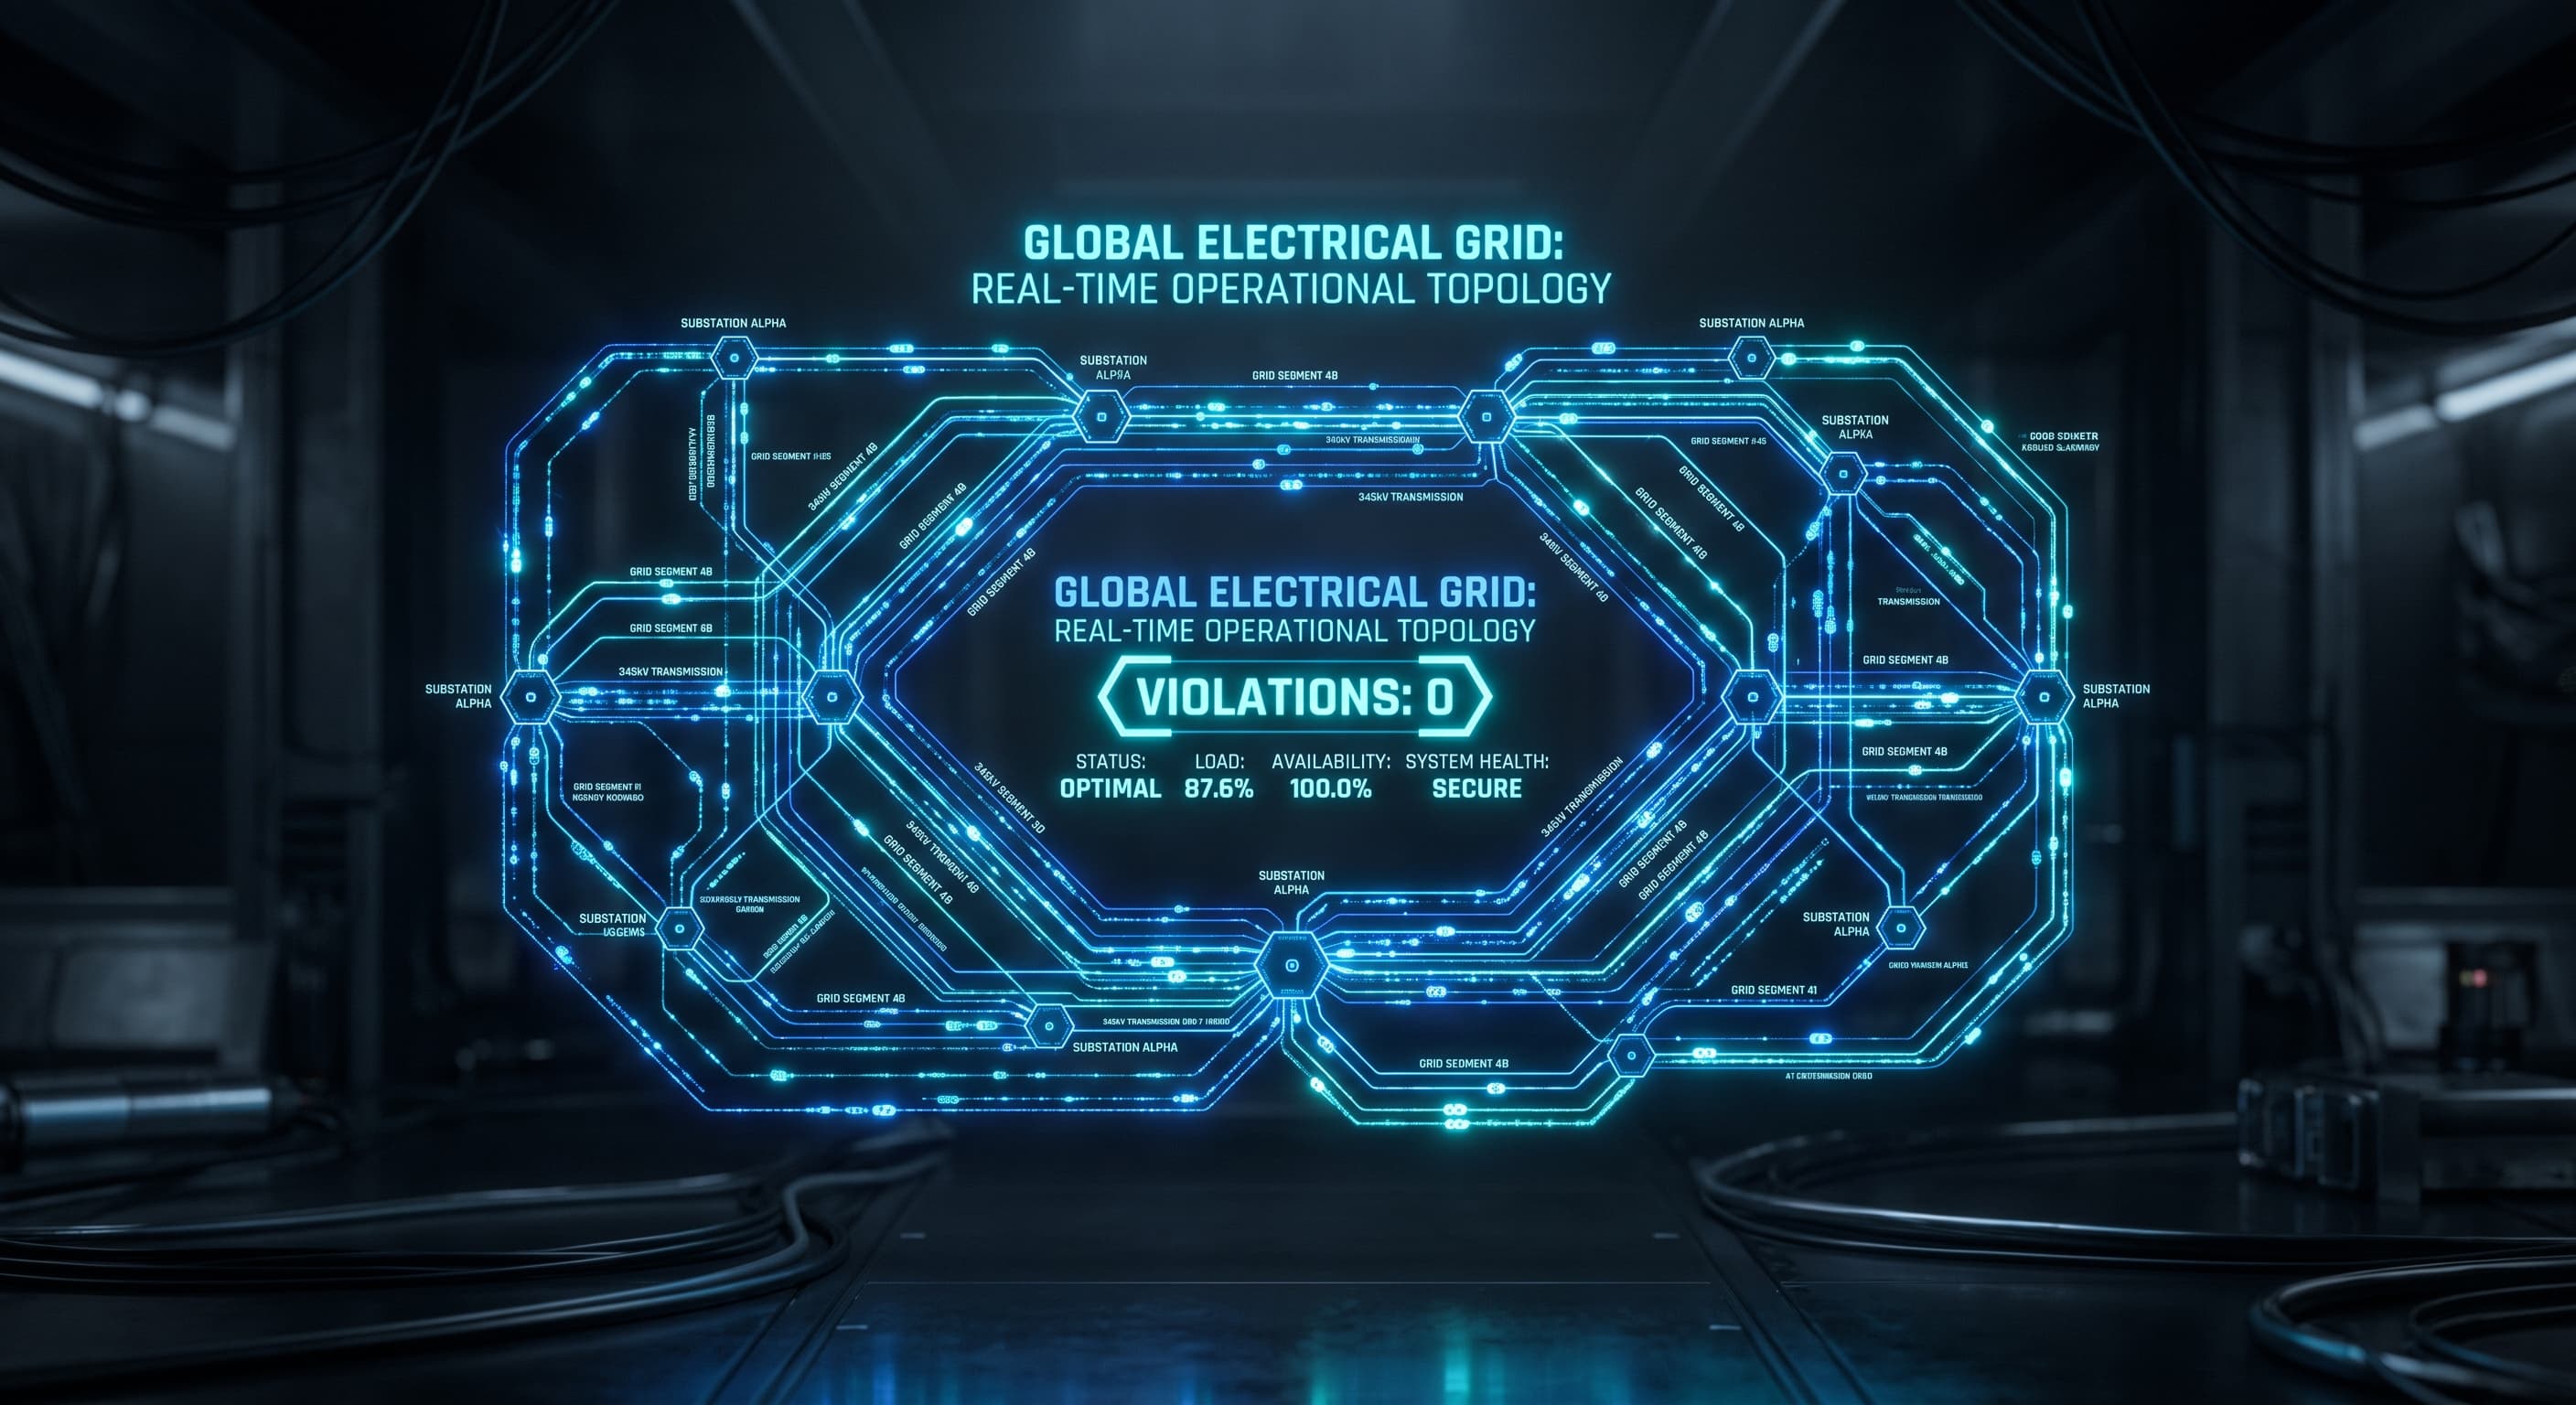
The Reactive Power Inversion () and the STATCOM Fix
Fourteenth entry in this series. The previous post showed that connection feasibility splits along transmission voltage tiers: 0% violations on the 500 kV extra-high-voltage backbone, but 66.4% violations (and 55.3% nose-curve collapses) on 132 kV sub-transmission.
The natural question for a power engineer is why transmission lines collapse under multi-hundred-megawatt loads. The intuitive answer is "too much real power." But in alternating-current transmission systems, active megawatts () are rarely the immediate cause of steady-state voltage collapse.
At transmission voltages, the line impedance ratio inverts completely from low voltage. Lines are heavily inductive (), making reactive power () the dominant lever governing bus voltage. Here, a data centre's power factor matters far more than its real-power draw — and uncoordinated clustering across adjacent substations can pull down an entire transmission corridor.
The governing physics:
In low-voltage distribution networks (Act II), conductors are predominantly resistive (R/X ≈ 2.0–5.0). Active power injection () directly forces voltage rise, while reactive power is a secondary factor.
At wholesale transmission voltages (132 kV to 500 kV), the physics flips. High-voltage lines use thick, bundled aluminium conductors spaced widely apart, resulting in low resistance and high series inductance. Across our NEM transmission model, line impedance measurements yield:
X/R ≈ 2.0 to 5.0+
From the linearized power-flow Jacobian, the sensitivity of bus voltage to active and reactive power demands is given by:
∂V_i / ∂P_j ≈ R_ij / V_0, ∂V_i / ∂Q_j ≈ X_ij / V_0
Because is several times larger than , the voltage drop caused by reactive power demand () dwarfs the drop caused by active power.
When a 500 MW data centre operates with an uncompensated inductive power factor, it draws a massive stream of lagging MVArs from the grid. As reactive power travels across inductive lines, it rapidly drains generator excitation reserves and exhausts local capacitor banks, pulling the receiving bus straight into voltage collapse.
Auditing the power factor regimes
To quantify how much reactive power matters, we audited candidate connections across three power-factor (PF) operating regimes:
- Lagging (
PF = 0.98, inductive): Typical uncompensated industrial loads. - Unity (
PF = 1.0): Active front-end rectifiers with power-factor correction. - Leading (
PF = 0.98, capacitive): Equipping the facility with active STATCOM dynamic reactive support.
The contrast on regional 220 kV circuits is dramatic:
- Under lagging PF (uncompensated): Connection bus voltage drops below the 0.95 p.u. statutory limit at approximately 250 MW, and collapses entirely at 500 MW once generator reactive limits (
Q_lim) are reached. - Under unity or leading PF: Bus voltage remains comfortably above 0.95 p.u. up to 500 MW, and the physical loadability limit (
P_max) expands by more than 250 MW.
In transmission planning, requiring near-unity power factor or capacitive voltage support is not a minor grid-code detail — it is what prevents a facility from cutting its own hosting capacity in half.
Parametric STATCOM sizing: recovering constrained headroom
Can dedicated reactive compensation restore hosting capacity on constrained sub-transmission lines? We executed a parametric STATCOM sizing sweep (Q_statcom in 300 MVAr) directly at constrained transmission buses:
| Connection Node & Voltage | STATCOM Capacity | Compliant Headroom ( p.u.) | Collapse Limit (P_max) | Headroom Gain | Expansion Ratio |
|---|---|---|---|---|---|
| Western Sydney (Node 958, 132 kV) | 0 MVAr | 250 MW | 1,000 MW | — | 1.0× (Baseline) |
| | 100 MVAr | 400 MW | 1,000 MW | +150 MW | |
| | 200 MVAr | 500 MW | 1,000 MW | +250 MW | 2.0× |
| | 300 MVAr | 600 MW | 1,000 MW | +350 MW | 2.4× |
| Kerang Regional (Node 553, 220 kV) | 0 MVAr | 100 MW | 250 MW | — | 1.0× (Baseline) |
| | 100 MVAr | 200 MW | 300 MW | +100 MW | 2.0× |
| | 300 MVAr | 350 MW | 350 MW | +250 MW | 3.5× |
| Remote Outback Spur (Node 573, 132 kV) | 0 MVAr | 0 MW | 100 MW | — | Infeasible |
| | 50 MVAr | 50 MW | 100 MW | +50 MW | Recovered |
| | MVAr | Inadmissible: static injection causes no-load overvoltage ( p.u.) | — | — | Inadmissible |
Adding a 300 MVAr STATCOM expands safe connection headroom by 2.4× in Western Sydney and 3.5× in Kerang.
However, the audit revealed a crucial engineering boundary: on weak radial outback spurs (Node 573), static reactive injection exceeding 150 MVAr pushes off-peak voltage above the 1.05 p.u. upper limit during light loading. Reactive compensation cannot be fixed shunt capacitance — it must be dynamically modulated via closed-loop Automatic Voltage Regulators (AVR) or inverter-based STATCOM controls.

Power Systems & Grid Optimization
Infrastructure Mastery
The intelligence hub of the modern grid. This drive cabinet houses state-of-the-art power conversion and monitoring modules. Active cooling and EMI-shielded backplanes ensure seamless operations even under extreme thermal loads.
Spatial clustering in Sydney and Melbourne: why serial screening fails
AEMO’s pipeline data reveals that 60% of Australia's 67 GW pipeline is concentrated in Western Sydney and 40% in Greater Melbourne. Developers cluster around fibre routes, water cooling infrastructure, and metropolitan land.
What happens when multiple data centres connect within the same transmission corridor? We audited spatial clustering by connecting k = 1, 2, 3, 4 concurrent facilities (100 MW to 500 MW each) within the same transmission pocket:
- In Western Sydney (132 kV corridor): A single 100 MW facility connects safely with p.u. Two facilities pass. Three facilities pass. But clustering
k = 4facilities (400 MW total) compounds line impedance drops non-linearly, pulling corridor voltage down to 0.946 p.u. — breaching the 0.95 p.u. statutory floor. - In Melbourne West (220 kV corridor): The stiffer network absorbs up to 1.5 GW of dispersed load. But co-locating
k = 4500 MW facilities (2,000 MW total) drags the regional transmission bus to 0.9495 p.u., triggering statutory undervoltage.
This demonstrates why traditional serial connection screening fails in the era of AI data centres. When a network service provider evaluates connection requests one-by-one in an application queue, early applicants are approved because local headroom appears adequate. But successive connections accumulate compound impedance drops across shared upstream corridors, quietly driving the network toward voltage collapse.
The operational challenge
Static connection screening can size a STATCOM or enforce a power-factor standard. But real data centres are dynamic, high-ramp loads: large AI cluster training runs create abrupt multi-hundred-megawatt load steps. The next post moves from static screening to dynamic operations: how Subspace Identification and Kalman filtering provide system operators with 249 to 267 minutes of advance warning before statutory voltage limits are breached.
Reproducibility: reactive margin sweeps and spatial clustering audit
# Measure X/R line ratios across the NEM network:
# PYTHONPATH=pipeline python3 pipeline/dc_sensitivity_matrix.py
# Result: X/R ranges 2.0 to 5.0+ across 132-500 kV

# Auditing PF regimes and STATCOM sizing:
# PYTHONPATH=pipeline python3 pipeline/dc_reactive_margin_sweep.py
# PYTHONPATH=pipeline python3 pipeline/dc_tso_stability_audit.py
# Result: 300 MVAr STATCOM expands headroom by 2.4x (Sydney) and 3.5x (Kerang)

# Spatial clustering audit (Western Sydney and Melbourne corridors):
# PYTHONPATH=pipeline python3 pipeline/dc_clustering_audit.py
# Result: 4 x 100 MW in Western Sydney drops voltage to 0.946 p.u.
Full scripts and outputs: pipeline/dc_reactive_margin_sweep.py, pipeline/dc_tso_stability_audit.py, pipeline/dc_clustering_audit.py in the data-centre repository.